R Markdown Syntax: Hyperlinks, Images & Tables
Overview
Teaching: 10 min
Exercises: 10 minQuestions
How do I create hyperlinks in R Markdown?
How do I insert images or tables into R Markdown?
How do I resize images?
Objectives
Learn how to add hyperlinks to an R Markdown document
Find out how to insert images into an R Markdown document
Learn how to add tables into an R Markdown document
Creating Hyperlinks
Hyperlinks are created using the syntax [text](link) with no spaces in between the parentheses and the square brackets.
For example:
[RStudio](https://www.rstudio.com)
Now, let’s apply it to the template paper. Find where the “Center of Open Science” is mentioned and link the institution to their official website:
[Center for Open Science](https://www.cos.io/)
Time to Knit!
Check if you hyperlinks are working properly.
Challenge 4.1: Adding links
Let’s add another link to our paper. Now it is your turn! We want to create a hyperlink to the survey platform used in the study Survey Monkey (https://www.surveymonkey.com/).
Solution
Tip:
You can use html directly in your .rmd document to add a link that will open in a new tab, such as
<a href="http://www.ucsb.edu/" >target="_blank"> UCSB</a>. This syntax requires pandoc and link_attributes extension, that is by default included in R Markdown.
Inserting Images
You can add images to an R Markdown report using markdown syntax as follows:

You’ll notice this format is exactly the same as hyperlinks, but with the addition of an ! before the brackets and parentheses.
However, when you knit the report, RStudio will only be able to find your image if you have placed it in the right place - RELATIVE to your .Rmd file. This is where good file management becomes extremely important. We have placed all our images in the figs folder in the R-markdown project folder. In that case, make sure your path starts with ../figs/ along with the correct image name and file extension. Also the closing bracket and the opening parentheses should be close to each other, without any spaces in between.
Tip: Paths to Files
The specification of the list of folders to travel and the file name is called a path. A path that starts at the root folder of the computer is called an absolute path. A relative path starts at a given folder and provides the folders and file starting from that folder. Using relative paths will make a number of things easier. A path is made up of folder names. If the path is to a file, then the path will ends with a file name. The folders and files of a path are separated by a directory separator. There are a few special directory names. A single period
.indicates the current working directory. Two periods..indicates moving up a directory.
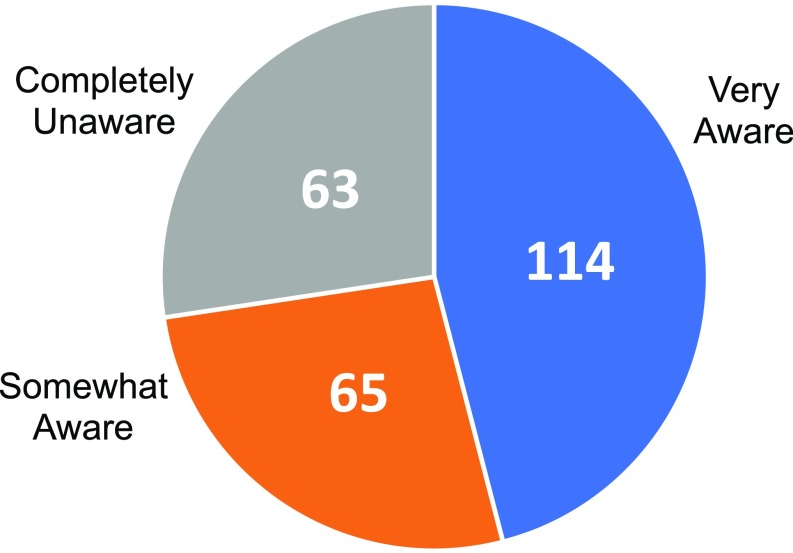
In our paper template there are three images (two pie charts) and one bar chart we want to include. Those are named fig1_paper.jpg, fig2_paper.jpg and fig3_paper.jpg.
To start let’s identify where Fig. 1 is mentioned in the paper. We will insert the image right after that. This image will have the caption labeled “FIGURE 1 - Knowledge and awareness of the current NIH guidelines on rigor and reproducibility.” (that we will be pasting in the chat). We need that caption to render the image.
The markdown should look like:

Note: A preview of your image should pop up automatically in RStudio if you have the correct relative path. But this will be only true if you type out the code, not if you copy and paste it.
This will output as:
Resizing Images
The image you just added looks a little too big, right? We can resize it by adjusting the width and height ratio. Let’s say we want this image to be half of the original size. In order to do that, we will have to add to the syntax:
{width=50% height=50%}
This will output as:
CHALLENGE 4.2 - Inserting Images
Locate the places for Fig. 2 and Fig. 3 and add them to the document using the captions below:
FIGURE 2 - Lack of requests for rigor and reproducibility documentation by users of shared resources
FIGURE 3 - Types of tools that cores would like to implement in their operations
*The bar chart should use a ratio of 60% x 80% in order to improve readability.
Solution:
Time to Knit!
Check how your images look now.
Inserting Tables
We can also use markdown syntax to insert a formatted table into our document. The basic syntax to insert a table looks like this:
Column Header | Column Header
---           | ---
Cell 1        |  Cell 2
Cell 3        |  Cell 4
Output:
Column Header | Column Header
— | —
Cell 1 | Cell 2
Cell 3 | Cell 4
Start with the column names/headers. Separate columns with the pipe ( | ) symbol. Right below the column headers use at least three dashes to separate the headers from the cells of the table. Then fill in the contents of the table row by row, separating columns using the pipe ( | ) symbol.
Note: Table Spacing
the spacing between cells in each row can help with readability in the R Markdown file, but is not necessary to get the correct output. As long as the pipe symbol is there, R Markdown will automatically format the table in your output. The following syntax will print the same table as the spaced out table above.
Column Header|Column Header
--- |---
Cell 1|Cell 2
Cell 3|Cell 4
You can use text emphasis in the table using the same syntax as you use when emphasizing other plain text. The following change will bold the column headers in the output.
 **Column Header** | **Column Header**
 ---               | ---
 Cell 1            |  Cell 2
 Cell 3            |  Cell 4
Output:
| Column Header | Column Header |
|---|---|
| Cell 1 | Cell 2 |
| Cell 3 | Cell 4 |
Let’s create Table 1 in our paper in section 3.2 Current Landscape for Rigor and Transparency in Represented Shared Resources.
Start with the column headers “Category” and “N” in bold. Then add the separator between the header and the cells. We’ll also type out the first two rows of the table.
**Category** | **N**
--- | ---
Poor sample quality from users/sample variability/limited biological material | 51
Lack of well-trained principle investigators and lab members/Poor oversight | 45
CHALLENGE 4.3 - Complete the Table
Finish Table 1 by adding the rest of the rows.
SOLUTION
Time to Knit!
Check how the table you have just created looks like.
Note: Advanced & Interactive Tables
There are some packages that allow you to make more advanced and interactive tables. Here are some references for these packages: https://cran.r-project.org/web/packages/kableExtra/vignettes/awesome_table_in_html.html and https://www.htmlwidgets.org/showcase_datatables.html
Key Points
R Markdown syntax for hyperlinks
R Markdown syntax for images
You can resize images with R Markdown
You can easily create basic tables with R Markdown