Combining ggplo2 and dplyr
Overview
Teaching: 15 min
Exercises: 15 minQuestions
How can I use ggplot2 and dplyr together?
Objectives
Use pipes (
%>%) to pass data toggplot()
Combining dplyr and ggplot2
First install and load ggplot2:
install.packages('ggplot2')
library("ggplot2")
In the plotting lesson we looked at how to make a multi-panel figure by adding
a layer of facet panels using ggplot2. Here is the code we used (with some
extra comments):
# Filter countries located in the Americas
americas <- gapminder[gapminder$continent == "Americas", ]
# Make the plot
ggplot(data = americas, mapping = aes(x = year, y = lifeExp)) +
  geom_line() +
  facet_wrap( ~ country) +
  theme(axis.text.x = element_text(angle = 45))

This code makes the right plot but it also creates an intermediate variable
(americas) that we might not have any other uses for. Just as we used
%>% to pipe data along a chain of dplyr functions we can use it to pass data
to ggplot(). Because %>% replaces the first argument in a function we don’t
need to specify the data = argument in the ggplot() function. By combining
dplyr and ggplot2 functions we can make the same figure without creating any
new variables or modifying the data.
gapminder %>%
  # Filter countries located in the Americas
  filter(continent == "Americas") %>%
  # Make the plot
  ggplot(mapping = aes(x = year, y = lifeExp)) +
  geom_line() +
  facet_wrap( ~ country) +
  theme(axis.text.x = element_text(angle = 45))

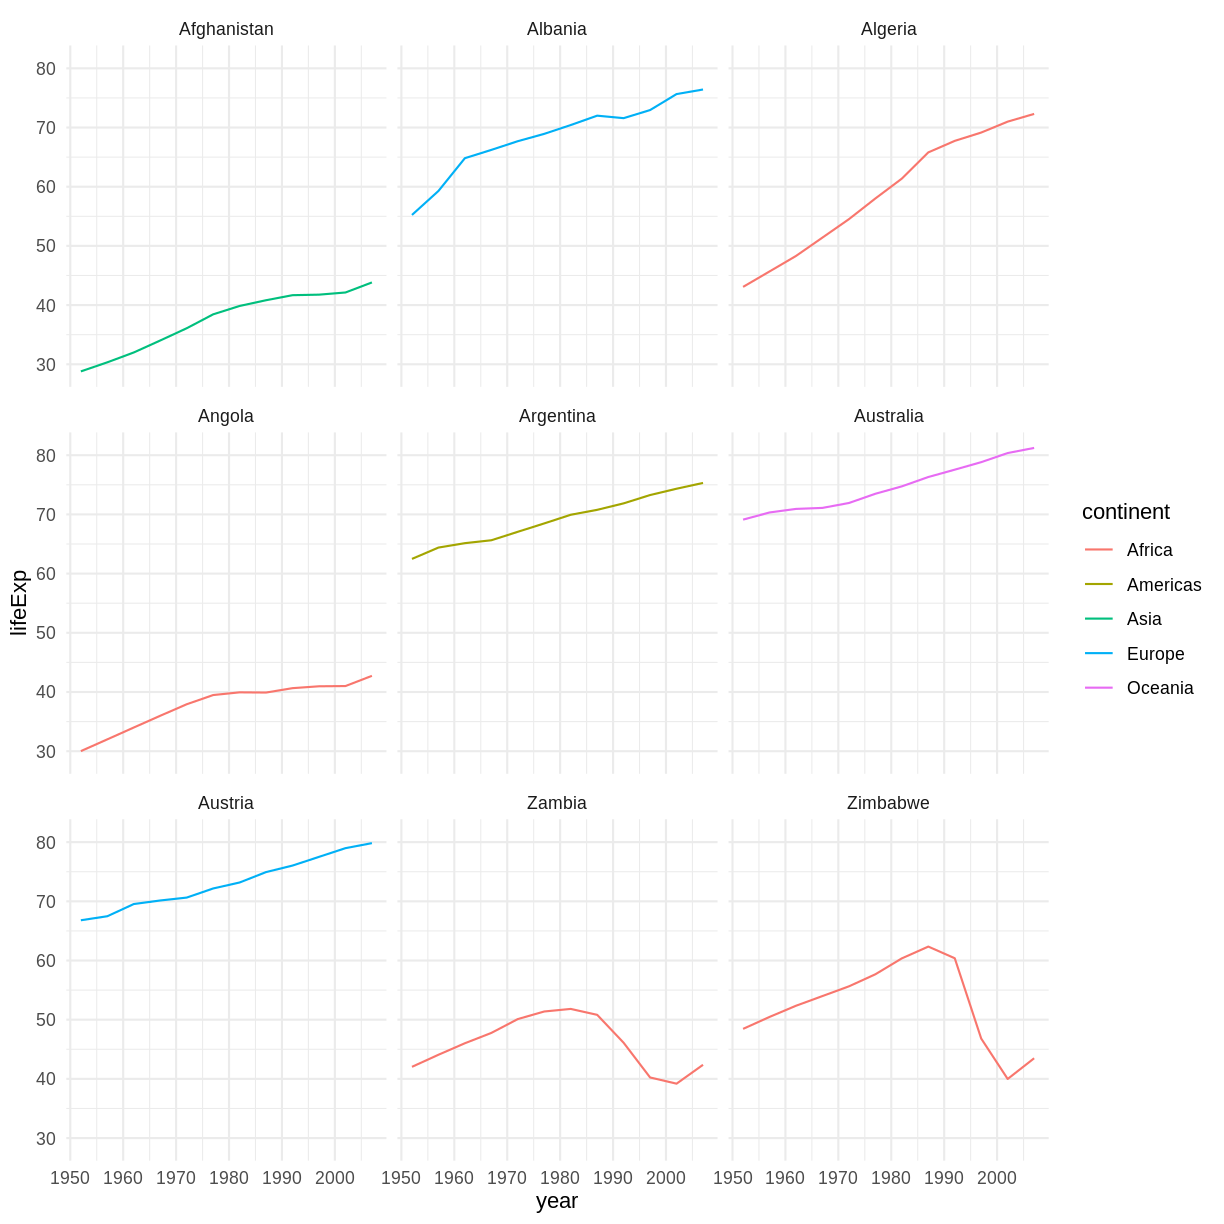
More examples of using the function mutate() and the ggplot2 package.
gapminder %>%
  # extract first letter of country name into new column
  mutate(startsWith = substr(country, 1, 1)) %>%
  # only keep countries starting with A or Z
  filter(startsWith %in% c("A", "Z")) %>%
  # plot lifeExp into facets
  ggplot(aes(x = year, y = lifeExp, colour = continent)) +
  geom_line() +
  facet_wrap(vars(country)) +
  theme_minimal()
Advanced Challenge
Calculate the average life expectancy in 2002 of 2 randomly selected countries for each continent. Then arrange the continent names in reverse order. Hint: Use the
dplyrfunctionsarrange()andsample_n(), they have similar syntax to other dplyr functions.Solution to Advanced Challenge
lifeExp_2countries_bycontinents <- gapminder %>%
   filter(year==2002) %>%
   group_by(continent) %>%
   sample_n(2) %>%
   summarize(mean_lifeExp=mean(lifeExp)) %>%
   arrange(desc(mean_lifeExp))
Other great resources
- R for Data Science
- Data Wrangling Cheat sheet
- Introduction to dplyr
- Data wrangling with R and RStudio
Key Points
Use
ggplot2to create plots.Think about graphics in layers: aesthetics, geometry, statistics, scale transformation, and grouping.