Number of responses
Code
library (tidyverse)library (bslib)library (shiny)library (bsicons)source ("scripts/helper_functions.R" )# list of workshop IDs to filter results <- c ("2025-01-14-ucsb-python" )<- read_csv ("data-joined/all_workshops.csv" ) %>% filter (workshop %in% workshops)# Fix comma separator <- results %>% mutate (findout_select.pre = str_replace_all ("Twitter, Facebook, etc." , "Twitter; Facebook; etc." ))<- results %>% select (ends_with (".pre" ))<- results %>% select (ends_with (".post" ))<- read_csv ("data/shoreline/2025-01-14-ucsb-python-shoreline.csv" ) %>% filter (` RSVP'ed ` == 'Yes' )<- sum (apply (post_survey, 1 , function (row) all (is.na (row))))<- sum (apply (pre_survey, 1 , function (row) all (is.na (row))))<- nrow (results)<- nrow (results) - n_pre - n_postlayout_columns (value_box (title = "RSVP'ed Yes - Shoreline" , value = nrow (shoreline), ,theme = NULL , showcase = bs_icon ("card-checklist" ), showcase_layout = "left center" ,full_screen = FALSE , fill = TRUE , height = NULL value_box (title = "Total survey responses" , value = n_total, ,theme = NULL , showcase = bs_icon ("people-fill" ), showcase_layout = "left center" ,full_screen = FALSE , fill = TRUE , height = NULL value_box (title = "Both pre- and post-" , value = n_both, , theme = NULL ,showcase = bs_icon ("arrows-expand-vertical" ), showcase_layout = "left center" ,full_screen = FALSE , fill = TRUE , height = NULL value_box (title = "Only pre-workshop" , value = n_pre, ,theme = NULL , showcase = bs_icon ("arrow-left-short" ), showcase_layout = "left center" ,full_screen = FALSE , fill = TRUE , height = NULL value_box (title = "Only post-workshop" , value = n_post, , theme = NULL ,showcase = bs_icon ("arrow-right-short" ), showcase_layout = "left center" ,full_screen = FALSE , fill = TRUE , height = NULL
RSVP'ed Yes - Shoreline
55
Total survey responses
31
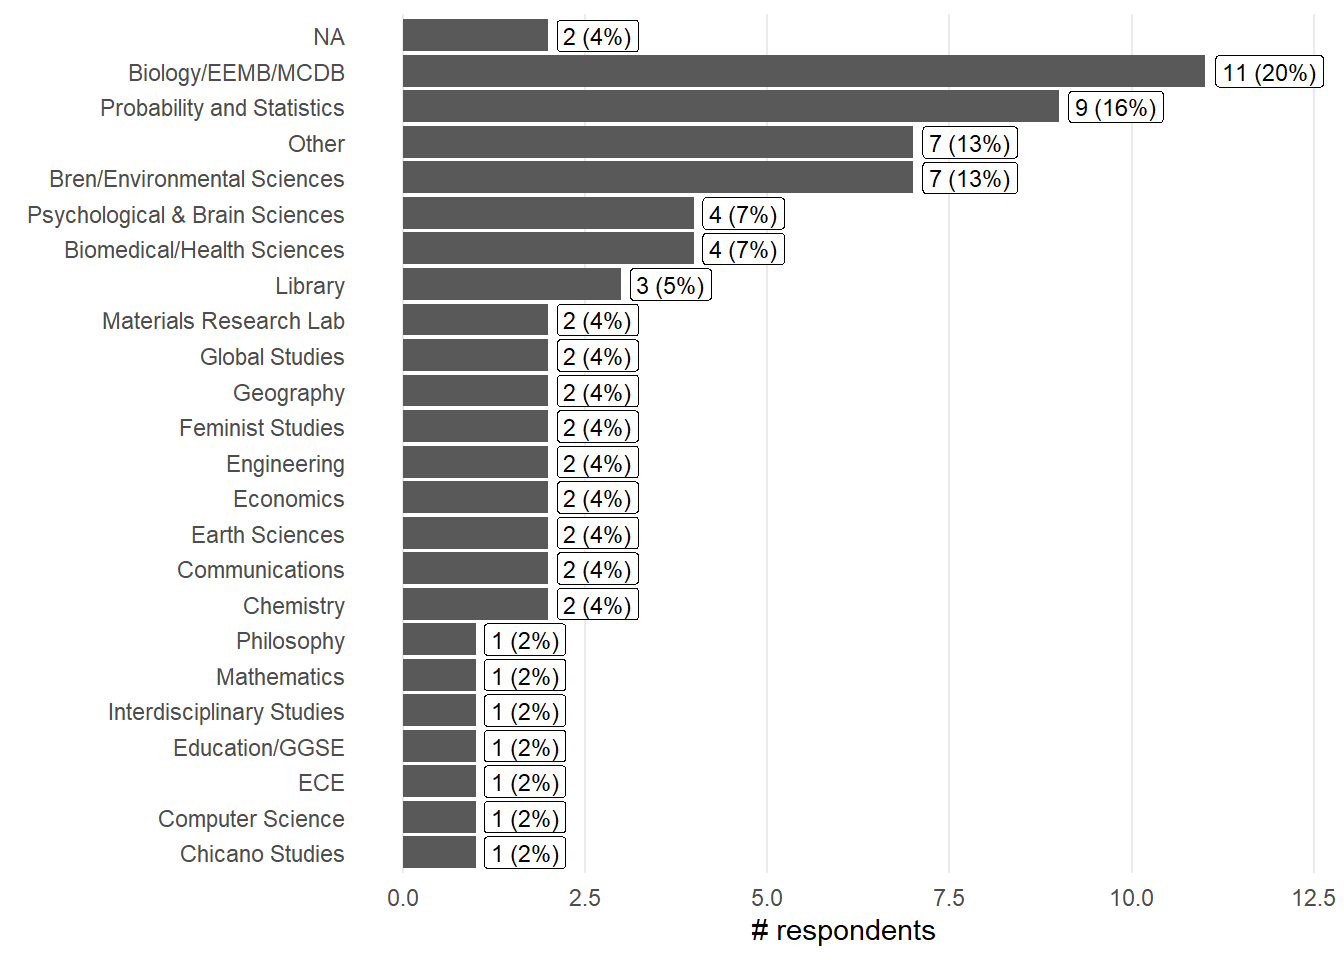
Departments (Shoreline info)
Code
<- shoreline %>% select (starts_with ("Please" )) %>% names ()<- shoreline %>% rename (dept_select.pre = name_var) %>% select (dept_select.pre) %>% separate_rows (dept_select.pre, sep= "," ) %>% mutate (dept_select.pre = str_trim (dept_select.pre)) %>% count (dept_select.pre, name = "count" ) %>% mutate (percent = (count / nrow (shoreline)) * 100 ,text = sprintf ("%.0f (%.0f%%)" , count, percent))ggplot (depts_2, aes (y= reorder (dept_select.pre, count), x= count)) + geom_col () + geom_label (aes (label = text, hjust = - 0.1 ),size = 3 ) + labs (x = "# respondents" , y = element_blank ()) + theme_minimal () + theme (panel.grid.minor = element_blank (),panel.grid.major.y = element_blank ()+ expand_limits (x = c (0 ,max (depts_2$ count)* 1.1 ))
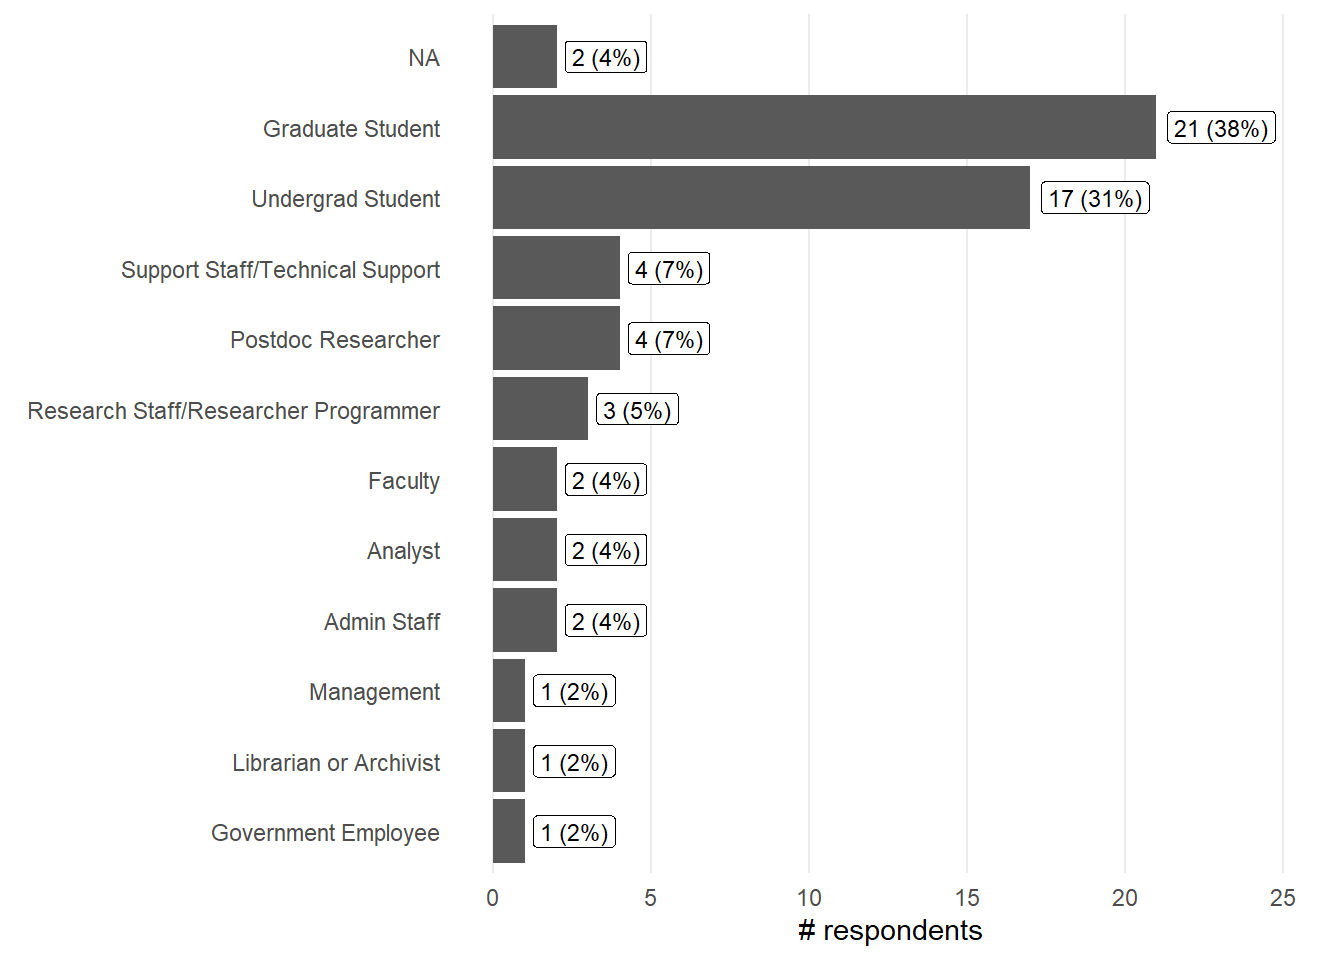
Current occupation / Career stage (Shoreline info)
Code
<- shoreline %>% select (starts_with ("What is" )) %>% names ()<- shoreline %>% rename (occupation.pre = name_var) %>% select (occupation.pre) %>% separate_rows (occupation.pre, sep= "," ) %>% mutate (occupation.pre = str_trim (occupation.pre)) %>% count (occupation.pre, name = "count" ) %>% mutate (percent = (count / nrow (shoreline)) * 100 ,text = sprintf ("%.0f (%.0f%%)" , count, percent))ggplot (ocup_2, aes (y= reorder (occupation.pre, count), x= count)) + geom_col () + geom_label (aes (label = text, hjust = - 0.1 ),size = 3 ) + labs (x = "# respondents" , y = element_blank ()) + theme_minimal () + theme (panel.grid.minor = element_blank (),panel.grid.major.y = element_blank ()+ expand_limits (x = c (0 ,max (ocup_2$ count)* 1.2 ))
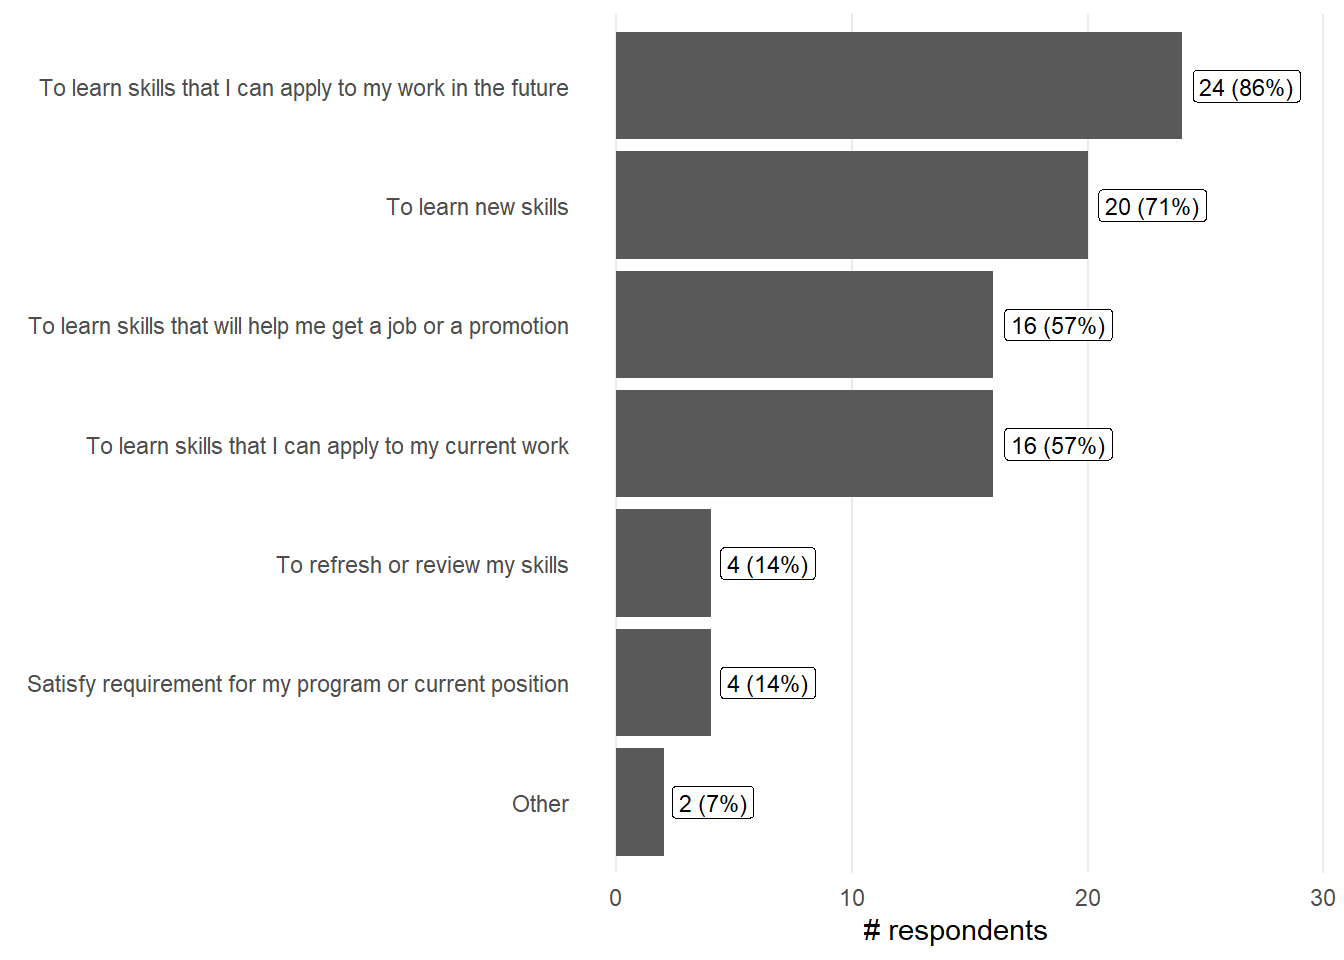
Motivation - Why are you participating in this workshop?
Code
<- results %>% select (motivation_select.pre) %>% separate_rows (motivation_select.pre, sep= "," ) %>% mutate (motivation_select.pre = str_trim (motivation_select.pre)) %>% count (motivation_select.pre, name = "count" ) %>% drop_na () %>% mutate (percent = (count / (n_total - n_post)) * 100 ,text = sprintf ("%.0f (%.0f%%)" , count, percent))ggplot (motiv, aes (y= reorder (motivation_select.pre, count), x= count)) + geom_col () + geom_label (aes (label = text, hjust = - 0.1 ),size = 3 ) + labs (x = "# respondents" , y = element_blank ()) + theme_minimal () + theme (panel.grid.minor = element_blank (),panel.grid.major.y = element_blank ()+ expand_limits (x = c (0 ,max (motiv$ count)* 1.2 ))
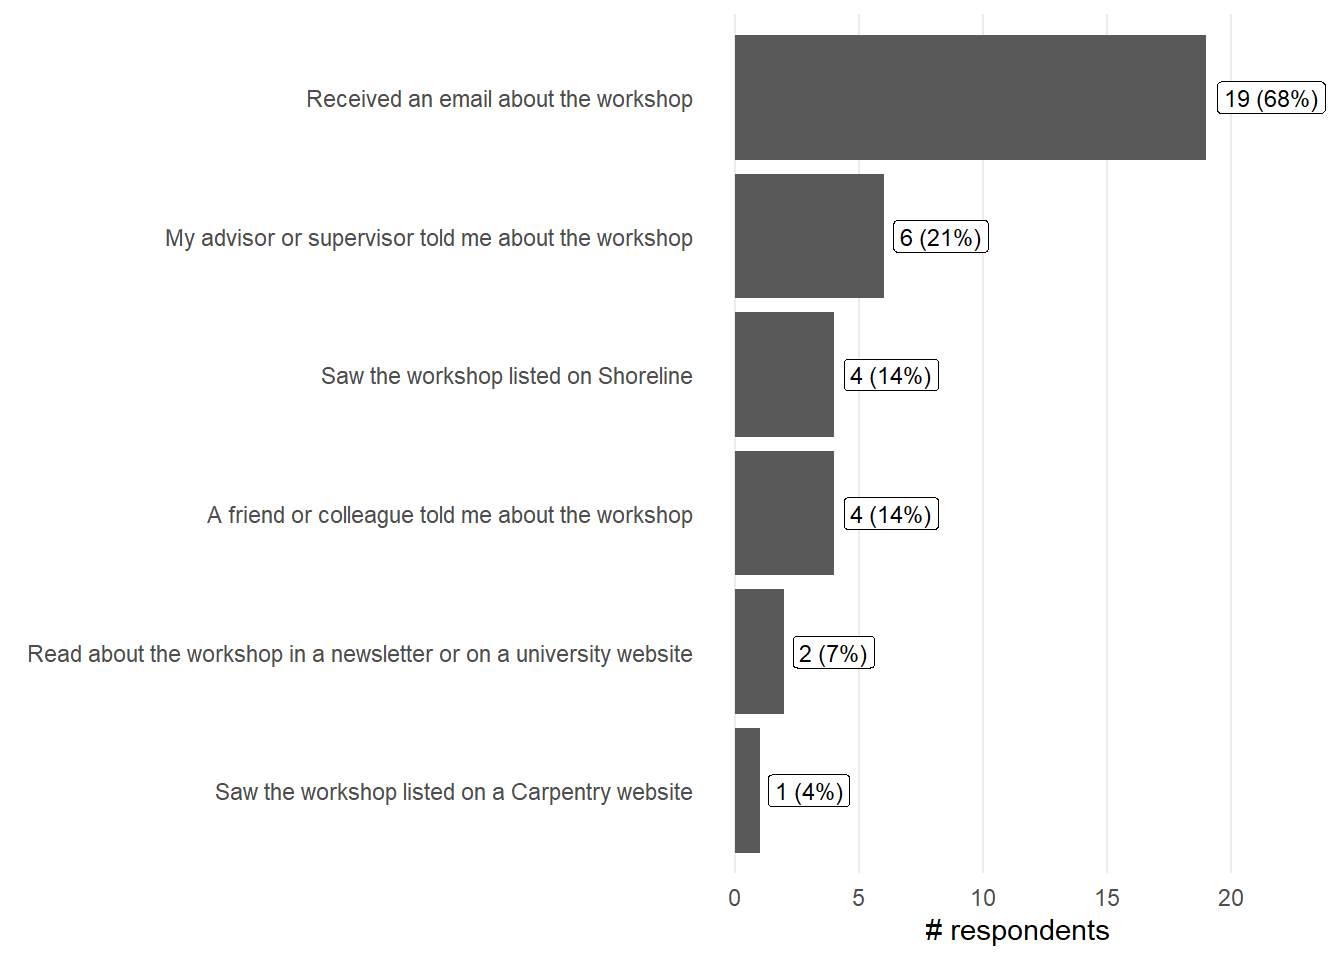
How did you find out about this workshop?
Code
<- results %>% select (findout_select.pre) %>% separate_rows (findout_select.pre, sep= "," ) %>% mutate (findout_select.pre = str_trim (findout_select.pre)) %>% count (findout_select.pre, name = "count" ) %>% drop_na () %>% mutate (percent = (count / (n_total - n_post)) * 100 ,text = sprintf ("%.0f (%.0f%%)" , count, percent))ggplot (findw, aes (y= reorder (findout_select.pre, count), x= count)) + geom_col () + geom_label (aes (label = text, hjust = - 0.1 ),size = 3 ) + labs (x = "# respondents" , y = element_blank ()) + theme_minimal () + theme (panel.grid.minor = element_blank (),panel.grid.major.y = element_blank ()+ expand_limits (x = c (0 ,max (findw$ count)* 1.2 ))
What you most hope to learn?
Code
%>% group_by (workshop) %>% select (workshop, hopes.pre) %>% drop_na ()
2025-01-14-ucsb-python
I hope to learn Python and apply it to my current research
2025-01-14-ucsb-python
Gaining a foundation and guided introduction in using these tools in tandem (git/version control, SQL+python/R and geospatial data)
2025-01-14-ucsb-python
I have a Microsoft Access database, and I wish to learn R and Python.
2025-01-14-ucsb-python
I would like to sharpen my python skills and increase the application I have to data analysis
2025-01-14-ucsb-python
Very basic proficiency in organizing and analyzing data in python. Ideally enough to build a simple automated pipeline for routine mass spectrometry data manipulation
2025-01-14-ucsb-python
How to apply Python in library work assisting patrons/researchers directly
2025-01-14-ucsb-python
How to organize and manipulate data with Python.
2025-01-14-ucsb-python
To gain new skills and get exposure to this type of work.
2025-01-14-ucsb-python
how to use python for my projects.
2025-01-14-ucsb-python
Better understanding of data analysis
2025-01-14-ucsb-python
how to analyze my data more efficiently and make complex graphs
2025-01-14-ucsb-python
I hope to at least have an idea of how Python works and how to do very basic analysis that could help in a variety of fields.
2025-01-14-ucsb-python
learn basics of python programming to use in my research
2025-01-14-ucsb-python
I hope to learn adequate Python skills to help with job opportunities
2025-01-14-ucsb-python
I hope to gain some familiarity and confidence with the Python programming system.
2025-01-14-ucsb-python
If a career in data analytics would be right for me
2025-01-14-ucsb-python
Preparation for using Python for remote sensing analyses.
2025-01-14-ucsb-python
Learn how to apply python programming knowledge into data analysis.
2025-01-14-ucsb-python
Familiarize myself with new technologies. I am a beginner. But I work with the IT Internship program as the program manager. I like to be familiar with the different concepts that the students work with. Thank you!
2025-01-14-ucsb-python
General knowledge about Python!
2025-01-14-ucsb-python
how to most efficiently set up data pipelines
2025-01-14-ucsb-python
I hope to gain basic understanding about the skills and practice the practical skills so as to master them and be able to further polish them on my own
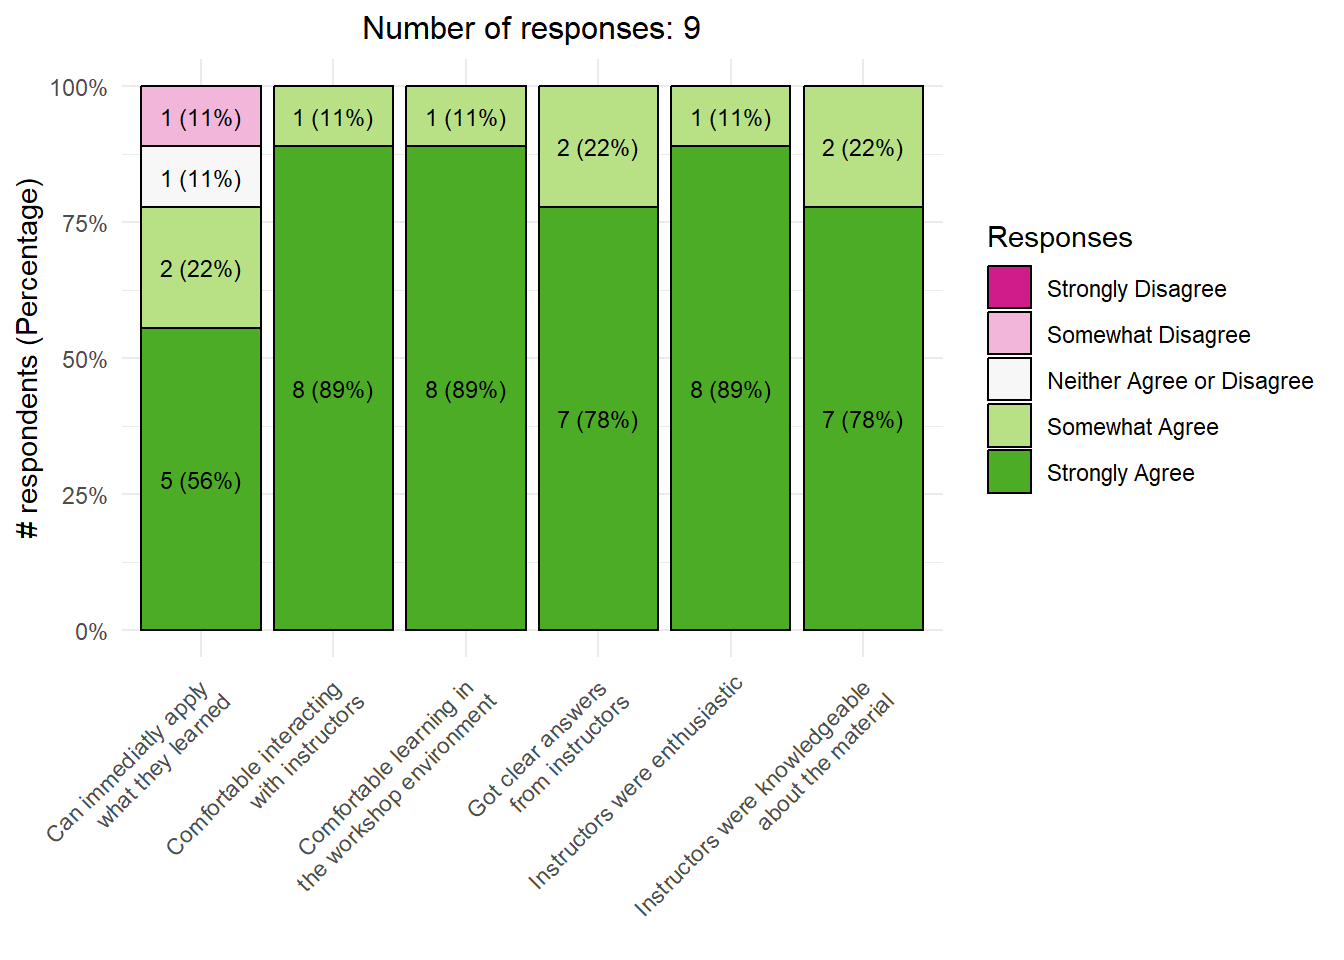
Learning environment in the workshop
Code
<- c ("Strongly Disagree" , "Somewhat Disagree" , "Neither Agree or Disagree" ,"Somewhat Agree" , "Strongly Agree" )addNA (orderedq)
Code
<- results %>% select (join_key, agree_apply.post, agree_comfortable.post, agree_clearanswers.post,%>% filter (! if_all (- join_key, is.na))<- nrow (agree_questions)<- agree_questions %>% pivot_longer (cols = - join_key, names_to = "Question" , values_to = "Response" ) %>% mutate (Response = factor (Response, levels = orderedq),Question = recode (Question,"agree_apply.post" = "Can immediatly apply what they learned" ,"agree_comfortable.post" = "Comfortable learning in the workshop environment" ,"agree_clearanswers.post" = "Got clear answers from instructors" ,"agree_instr_enthusiasm.post" = "Instructors were enthusiastic" ,"agree_instr_interaction.post" = "Comfortable interacting with instructors" ,"agree_instr_knowledge.post" = "Instructors were knowledgeable about the material" <- agree_questions %>% count (Question, Response, name = "count" ) %>% mutate (percent = (count / n_agree_questions) * 100 ,text = sprintf ("%.0f (%.0f%%)" , count, percent))ggplot (summary_data, aes (x = Question, y = count, fill = Response)) + geom_col (position = "fill" , color = "black" , show.legend = TRUE ) + scale_y_continuous (labels = scales:: percent_format ()) + scale_fill_manual (values = c ("Strongly Disagree" = "#d01c8b" , "Somewhat Disagree" = "#f1b6da" , "Neither Agree or Disagree" = "#f7f7f7" , "Somewhat Agree" = "#b8e186" , "Strongly Agree" = "#4dac26" ), na.translate = TRUE , na.value = "#cccccc" , breaks = orderedq, drop = FALSE ) + geom_text (aes (label = text), size = 3 ,position = position_fill (vjust = 0.5 )) + labs (y = "# respondents (Percentage)" , x = element_blank (), fill = "Responses" ,subtitle = paste0 ("Number of responses: " , n_agree_questions)) + theme_minimal () + theme (axis.text.x = element_text (angle = 45 , hjust = 1 ),plot.subtitle = element_text (hjust = 0.5 , size = 12 ))
How an instructor or helper affected your learning experience
Code
%>% group_by (workshop) %>% select (workshop, instructor_example.post) %>% drop_na ()
2025-01-14-ucsb-python
Using the blue and red stickies, and constantly reminding us to use it
2025-01-14-ucsb-python
Was able to answer all of my questions and make the material more clear when I felt that it needed further explanation.
2025-01-14-ucsb-python
If there was a moment when I had a hiccup or an error instructors helped clarify where an error occurred to help me get back on track
2025-01-14-ucsb-python
When I got some problem with the challenge, they came immediately and were really willing to help me solving the problem.
2025-01-14-ucsb-python
Any question I had was immediately answered and with enthusiasm, Jean especially was a very enthusiastic and helpful person!
2025-01-14-ucsb-python
No, I did not encounter any accessibility issues. Everything was great, and there were no barriers to my participation.”
2025-01-14-ucsb-python
I am a very slow learner (new to Python; and any language for that matter), Sigrid and Jose were very patient with me. If the material sped along too quickly, they were here to offer support to get me back-on-track.
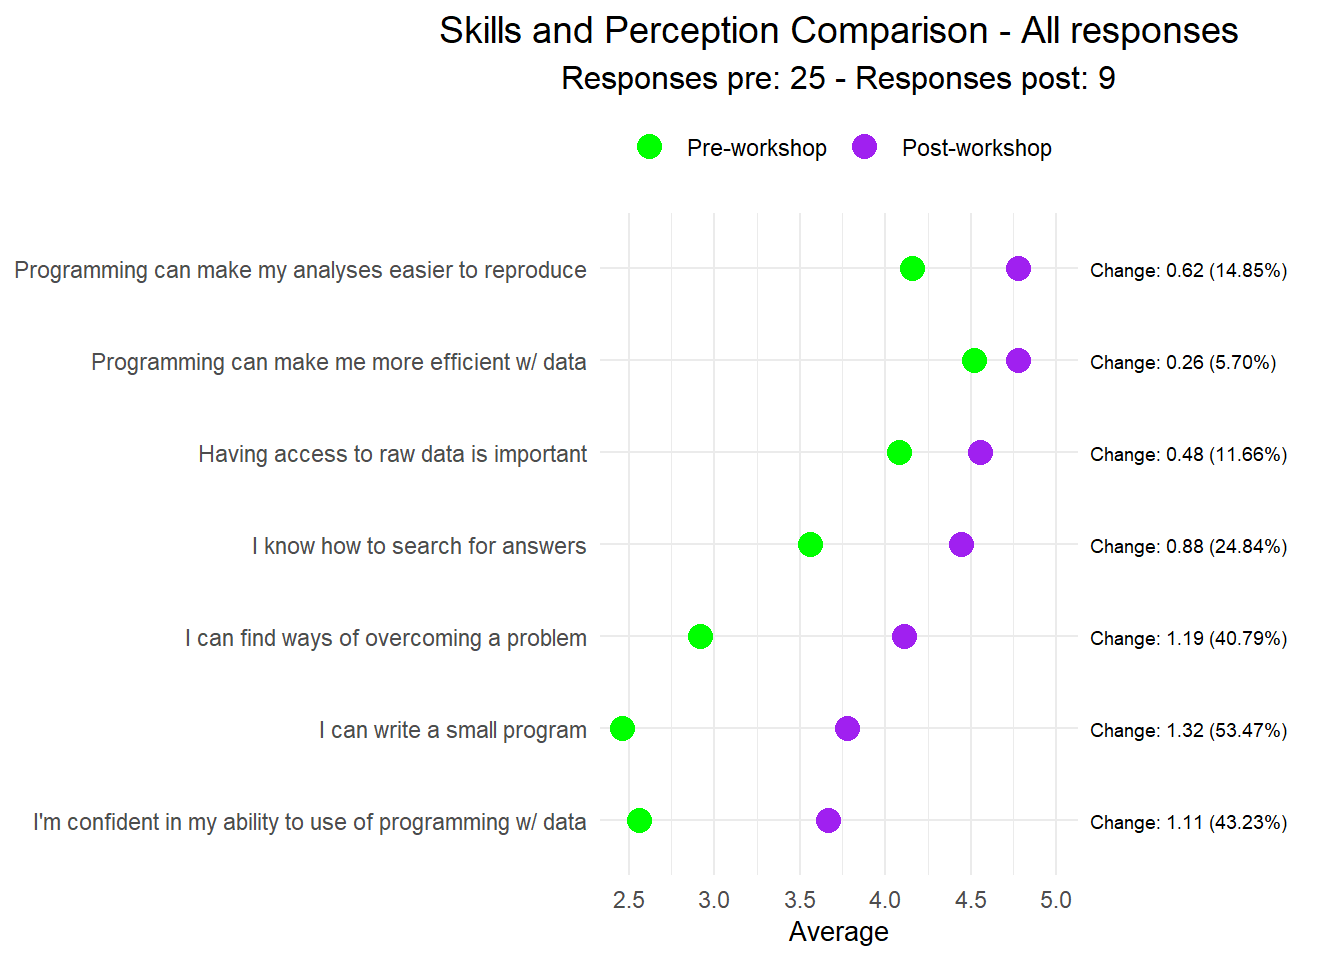
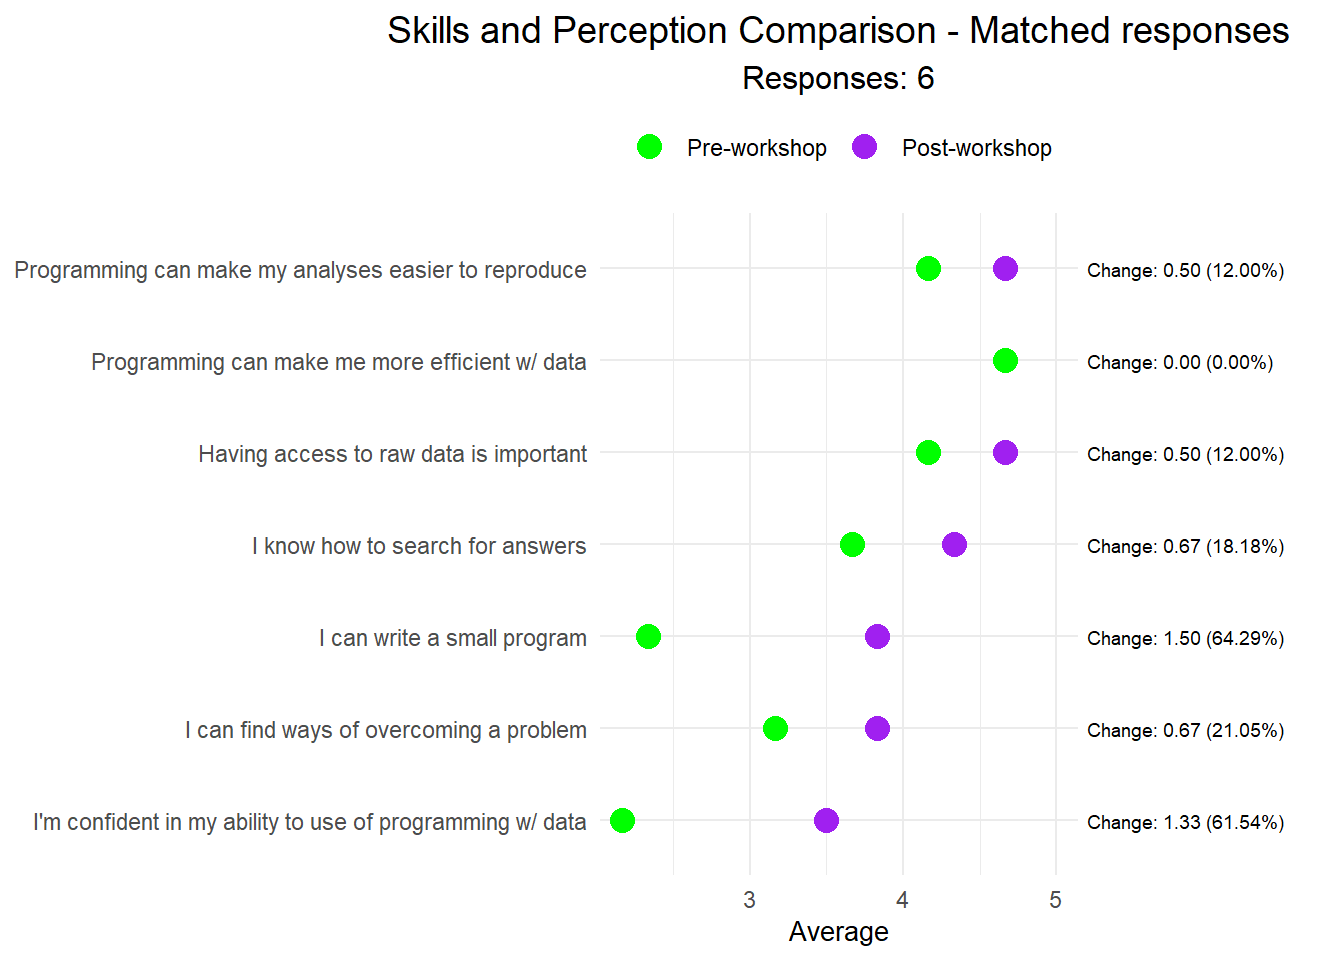
Skills and perception comparison
Code
# Calculate mean scores and make graph for all respondents (only_matched=FALSE) tryCatch (<- get_mean_scores_nresp (results, only_matched= FALSE )graph_pre_post (mean_nresp$ mean_scores, mean_nresp$ n_resp_pre, mean_nresp$ n_resp_post, mean_nresp$ n_resp_pre_post, only_matched= FALSE )error = function (cond) {message ("Could not do the plots as there are no pre or post results to show" )
Code
# Calculate mean scores and make graph for only matched respondents in pre and post (only_matched=TRUE) tryCatch (<- get_mean_scores_nresp (results, only_matched= TRUE )graph_pre_post (mean_nresp$ mean_scores, mean_nresp$ n_resp_pre, mean_nresp$ n_resp_post, mean_nresp$ n_resp_pre_post, only_matched= TRUE )error = function (cond) {message ("Could not do the plots as there are no pre or post results to show" )
Workshop Strengths
Code
%>% group_by (workshop) %>% select (workshop, workshop_strengths.post) %>% drop_na ()
2025-01-14-ucsb-python
It’s a comfortable pace, and the instructors are very helpful.
2025-01-14-ucsb-python
Joins, plots, importing, exporting, shortcuts
2025-01-14-ucsb-python
clear and easy to follow examples
2025-01-14-ucsb-python
I really appreciated the challenges. I feel like this was the strongest strength of the workshop and helped give participants time to practice skills presented during the workshop.
2025-01-14-ucsb-python
Covers a wide range of python functions and usage
2025-01-14-ucsb-python
nothing
2025-01-14-ucsb-python
Computer literacy! A safe space for learning something new! Expanding my understanding of terminology used regularly in my work setting! Highly recommend to others (even if not planning to use regularly it’s really great to have a better understanding of programming).
Ways to improve the workshop
Code
%>% group_by (workshop) %>% select (workshop, workshop_improved.post) %>% drop_na ()
2025-01-14-ucsb-python
More lessons, maybe 5 classes instead of 3 classes.
2025-01-14-ucsb-python
Being able to access this code after the workshop or being able to download everything for your own computer and work.
2025-01-14-ucsb-python
more explanation of how the functions work and why you need to include certain syntax
2025-01-14-ucsb-python
I think one more workshop day could be included that goes through a flow through with the data that combines all the skills use so kinda like a problem set.
2025-01-14-ucsb-python
N/A
2025-01-14-ucsb-python
I found the workshop to be very informative and engaging. However, one potential improvement could be providing more time for Q&A or group discussions to allow for deeper exploration of the topics. Additionally, having more interactive activities could enhance participant engagement
2025-01-14-ucsb-python
N/A
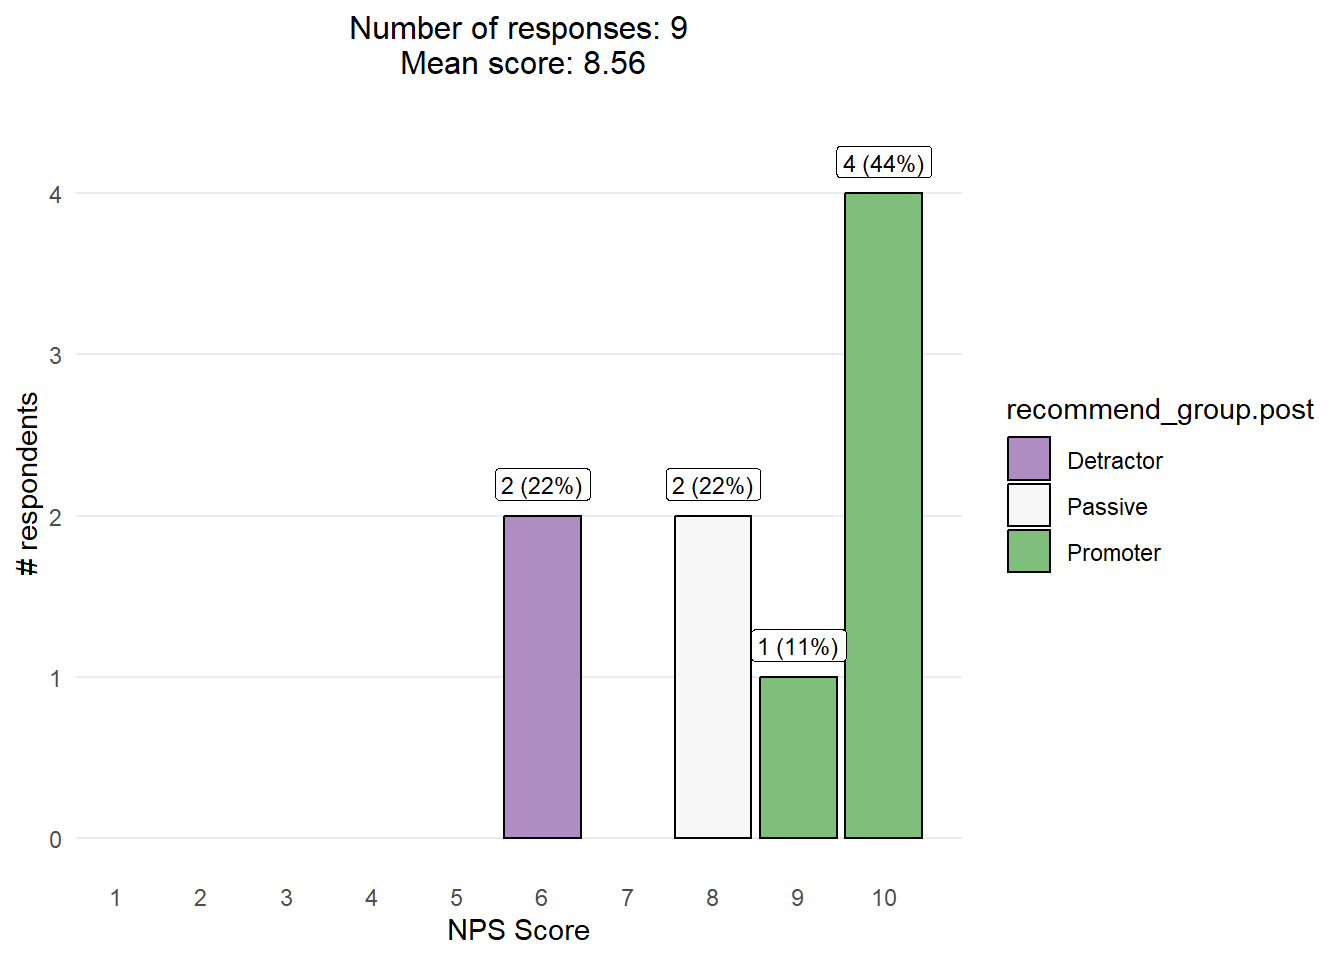
How likely are you to recommend this workshop? Scale 0 - 10
Code
<- c ("Detractor" , "Passive" , "Promoter" )<- results %>% count (recommend_group.post, recommende_score.post, name = "count" ) %>% drop_na () %>% mutate (recommend_group.post = factor (recommend_group.post, levels = orderedq),percent = (count/ sum (count)) * 100 ,text = sprintf ("%.0f (%.0f%%)" , count, percent))%>% ggplot (aes (x= recommende_score.post, y= count, fill= recommend_group.post)) + geom_col (color= "black" , show.legend = TRUE ) + scale_fill_manual (values = c ("Detractor" = "#af8dc3" , "Passive" = "#f7f7f7" , "Promoter" = "#7fbf7b" ), breaks = c ("Detractor" , "Passive" , "Promoter" ), drop = FALSE ) + geom_label (aes (label = text, vjust = - 0.5 ), fill = "white" , size= 3 ) + scale_x_continuous (breaks = 1 : 10 ) + labs (x = "NPS Score" , y = "# respondents" , subtitle = paste0 ("Number of responses: " , sum (nps$ count), " Mean score: " , format (weighted.mean (nps$ recommende_score.post, nps$ count), digits = 3 ))) + theme_minimal () + theme (panel.grid.minor = element_blank (),panel.grid.major.x = element_blank (),plot.subtitle = element_text (hjust = 0.5 , size = 12 )+ expand_limits (x = c (1 ,10 ),y = c (0 , max (nps$ count)* 1.1 ))
Topic Suggestions
Code
%>% group_by (workshop) %>% select (workshop, suggest_topics.post) %>% drop_na ()
2025-01-14-ucsb-python
Geospatial R one will be good
2025-01-14-ucsb-python
more about plotting would be helpful for me
2025-01-14-ucsb-python
N/A
2025-01-14-ucsb-python
Maybe a workshop on how to get into careers with Python? I’d love to be more involved and work on this myself
2025-01-14-ucsb-python
case studies
2025-01-14-ucsb-python
Power BI
Number of responses
#| message: false
library(tidyverse)
library(bslib)
library(shiny)
library(bsicons)
source("scripts/helper_functions.R")
# list of workshop IDs to filter results
workshops <- c("2025-01-15-ucsb-containers")
results <- read_csv("data-joined/all_workshops.csv") %>%
filter(workshop %in% workshops)
# Fix comma separator
results <- results %>%
mutate(findout_select.pre = str_replace_all(
findout_select.pre,
"Twitter, Facebook, etc.",
"Twitter; Facebook; etc."))
pre_survey <- results %>%
select(ends_with(".pre"))
post_survey <- results %>%
select(ends_with(".post"))
n_pre <- sum(apply(post_survey, 1, function(row) all(is.na(row))))
n_post <- sum(apply(pre_survey, 1, function(row) all(is.na(row))))
n_total <- nrow(results)
n_both <- nrow(results) - n_pre - n_post
layout_columns(
value_box(
title = "Total responses", value = n_total, ,
theme = NULL, showcase = bs_icon("people-fill"), showcase_layout = "left center",
full_screen = FALSE, fill = TRUE, height = NULL
),
value_box(
title = "Both pre- and post-", value = n_both, , theme = NULL,
showcase = bs_icon("arrows-expand-vertical"), showcase_layout = "left center",
full_screen = FALSE, fill = TRUE, height = NULL
),
value_box(
title = "Only pre-workshop", value = n_pre, ,
theme = NULL, showcase = bs_icon("arrow-left-short"), showcase_layout = "left center",
full_screen = FALSE, fill = TRUE, height = NULL
),
value_box(
title = "Only post-workshop", value = n_post, , theme = NULL,
showcase = bs_icon("arrow-right-short"), showcase_layout = "left center",
full_screen = FALSE, fill = TRUE, height = NULL
)
)
Departments
depts <- results %>% select(dept_select.pre) %>%
separate_rows(dept_select.pre, sep=",") %>%
mutate(dept_select.pre = str_trim(dept_select.pre)) %>%
count(dept_select.pre, name = "count") %>%
mutate(percent = (count / (n_total - n_post)) * 100,
text = sprintf("%.0f (%.0f%%)", count, percent))
ggplot(depts, aes(y=reorder(dept_select.pre, count), x=count)) +
geom_col() +
geom_label(aes(label = text, hjust = -0.1),
size = 3) +
labs(x = "# respondents", y = element_blank()) +
theme_minimal() +
theme(
panel.grid.minor = element_blank(),
panel.grid.major.y = element_blank()
) +
expand_limits(x = c(0,max(depts$count)*1.1))
“Other” Departments
other_depts <- results %>%
count(dept_other.pre, name = "count") %>%
drop_na() %>%
mutate(percent = (count / (n_total - n_post)) * 100,
text = sprintf("%.0f (%.0f%%)", count, percent))
ggplot(other_depts, aes(y=reorder(dept_other.pre, count), x=count)) +
geom_col() +
geom_label(aes(label = text, hjust = -0.1),
size = 3) +
labs(x = "# respondents", y = element_blank()) +
theme_minimal() +
theme(
panel.grid.minor = element_blank(),
panel.grid.major.y = element_blank()
) +
expand_limits(x = c(0,max(other_depts$count)*1.1))
Current occupation / Career stage
ocup <- results %>% select(occupation.pre) %>%
separate_rows(occupation.pre, sep=",") %>%
mutate(occupation.pre = str_trim(occupation.pre)) %>%
count(occupation.pre, name = "count") %>%
drop_na() %>%
mutate(percent = (count / (n_total - n_post)) * 100,
text = sprintf("%.0f (%.0f%%)", count, percent))
ggplot(ocup, aes(y=reorder(occupation.pre, count), x=count)) +
geom_col() +
geom_label(aes(label = text, hjust = -0.1),
size = 3) +
labs(x = "# respondents", y = element_blank()) +
theme_minimal() +
theme(
panel.grid.minor = element_blank(),
panel.grid.major.y = element_blank()
) +
expand_limits(x = c(0,max(ocup$count)*1.2))
Motivation - Why are you participating in this workshop?
motiv <- results %>% select(motivation_select.pre) %>%
separate_rows(motivation_select.pre, sep=",") %>%
mutate(motivation_select.pre = str_trim(motivation_select.pre)) %>%
count(motivation_select.pre, name = "count") %>%
drop_na() %>%
mutate(percent = (count / (n_total - n_post)) * 100,
text = sprintf("%.0f (%.0f%%)", count, percent))
ggplot(motiv, aes(y=reorder(motivation_select.pre, count), x=count)) +
geom_col() +
geom_label(aes(label = text, hjust = -0.1),
size = 3) +
labs(x = "# respondents", y = element_blank()) +
theme_minimal() +
theme(
panel.grid.minor = element_blank(),
panel.grid.major.y = element_blank()
) +
expand_limits(x = c(0,max(motiv$count)*1.2))
How did you find out about this workshop?
findw <- results %>% select(findout_select.pre) %>%
separate_rows(findout_select.pre, sep=",") %>%
mutate(findout_select.pre = str_trim(findout_select.pre)) %>%
count(findout_select.pre, name = "count") %>%
drop_na() %>%
mutate(percent = (count / (n_total - n_post)) * 100,
text = sprintf("%.0f (%.0f%%)", count, percent))
ggplot(findw, aes(y=reorder(findout_select.pre, count), x=count)) +
geom_col() +
geom_label(aes(label = text, hjust = -0.1),
size = 3) +
labs(x = "# respondents", y = element_blank()) +
theme_minimal() +
theme(
panel.grid.minor = element_blank(),
panel.grid.major.y = element_blank()
) +
expand_limits(x = c(0,max(findw$count)*1.2))
What you most hope to learn?
results %>% group_by(workshop) %>%
select(workshop, hopes.pre) %>%
drop_na()
Learning environment in the workshop
#| message: false
#| output: false
orderedq <- c("Strongly Disagree", "Somewhat Disagree", "Neither Agree or Disagree","Somewhat Agree", "Strongly Agree")
addNA(orderedq)agree_questions <- results %>%
select(join_key, agree_apply.post, agree_comfortable.post, agree_clearanswers.post,
agree_instr_enthusiasm.post, agree_instr_interaction.post, agree_instr_knowledge.post
) %>%
filter(!if_all(-join_key, is.na))
n_agree_questions <- nrow(agree_questions)
agree_questions <- agree_questions %>%
pivot_longer(cols = -join_key, names_to = "Question", values_to = "Response") %>%
mutate(Response = factor(Response, levels = orderedq),
Question = recode(Question,
"agree_apply.post" = "Can immediatly apply
what they learned",
"agree_comfortable.post" = "Comfortable learning in
the workshop environment",
"agree_clearanswers.post" = "Got clear answers
from instructors",
"agree_instr_enthusiasm.post" = "Instructors were enthusiastic",
"agree_instr_interaction.post" = "Comfortable interacting
with instructors",
"agree_instr_knowledge.post" = "Instructors were knowledgeable
about the material"
))
summary_data <- agree_questions %>%
count(Question, Response, name = "count") %>%
mutate(percent = (count / n_agree_questions) * 100,
text = sprintf("%.0f (%.0f%%)", count, percent))
ggplot(summary_data, aes(x = Question, y = count, fill = Response)) +
geom_col(position = "fill", color = "black", show.legend = TRUE) +
scale_y_continuous(labels = scales::percent_format()) +
scale_fill_manual(values = c("Strongly Disagree" = "#d01c8b",
"Somewhat Disagree" = "#f1b6da",
"Neither Agree or Disagree" = "#f7f7f7",
"Somewhat Agree" = "#b8e186",
"Strongly Agree" = "#4dac26"),
na.translate = TRUE, na.value = "#cccccc",
breaks = orderedq, drop = FALSE) +
geom_text(aes(label = text), size = 3,
position = position_fill(vjust = 0.5)) +
labs(y = "# respondents (Percentage)", x = element_blank(), fill = "Responses",
subtitle = paste0("Number of responses: ", n_agree_questions)) +
theme_minimal() +
theme(axis.text.x = element_text(angle = 45, hjust = 1),
plot.subtitle = element_text(hjust = 0.5, size = 12))
How an instructor or helper affected your learning experience
#| message: false
results %>%
group_by(workshop) %>%
select(workshop, instructor_example.post) %>%
drop_na()
Skills and perception comparison
# Calculate mean scores and make graph for all respondents (only_matched=FALSE)
tryCatch(
{
mean_nresp <- get_mean_scores_nresp(results, only_matched=FALSE)
graph_pre_post(mean_nresp$mean_scores, mean_nresp$n_resp_pre, mean_nresp$n_resp_post, mean_nresp$n_resp_pre_post, only_matched=FALSE)
},
error = function(cond) {
message("Could not do the plots as there are no pre or post results to show")
}
)
# Calculate mean scores and make graph for only matched respondents in pre and post (only_matched=TRUE)
tryCatch(
{
mean_nresp <- get_mean_scores_nresp(results, only_matched=TRUE)
graph_pre_post(mean_nresp$mean_scores, mean_nresp$n_resp_pre, mean_nresp$n_resp_post, mean_nresp$n_resp_pre_post, only_matched=TRUE)
},
error = function(cond) {
message("Could not do the plots as there are no pre or post results to show")
}
)
Workshop Strengths
results %>%
group_by(workshop) %>%
select(workshop, workshop_strengths.post) %>%
drop_na()
Ways to improve the workshop
results %>%
group_by(workshop) %>%
select(workshop, workshop_improved.post) %>%
drop_na()
How likely are you to recommend this workshop? Scale 0 - 10
orderedq <- c("Detractor", "Passive", "Promoter")
nps <- results %>%
count(recommend_group.post, recommende_score.post, name = "count") %>%
drop_na() %>%
mutate(recommend_group.post = factor(recommend_group.post, levels = orderedq),
percent = (count/sum(count)) * 100,
text = sprintf("%.0f (%.0f%%)", count, percent))
nps %>%
ggplot(aes(x=recommende_score.post, y=count, fill=recommend_group.post)) +
geom_col(color="black", show.legend = TRUE) +
scale_fill_manual(values = c("Detractor" = "#af8dc3", "Passive" = "#f7f7f7", "Promoter" = "#7fbf7b"), breaks = c("Detractor", "Passive", "Promoter"), drop = FALSE) +
geom_label(aes(label = text, vjust = -0.5), fill = "white", size= 3) +
scale_x_continuous(breaks = 1:10) +
labs(x = "NPS Score", y = "# respondents", subtitle = paste0("Number of responses: ", sum(nps$count), "
Mean score: ", format(weighted.mean(nps$recommende_score.post, nps$count), digits = 3))) +
theme_minimal() +
theme(
panel.grid.minor = element_blank(),
panel.grid.major.x = element_blank(),
plot.subtitle = element_text(hjust = 0.5, size = 12)
) +
expand_limits(x = c(1,10),
y = c(0, max(nps$count)*1.1))
Topic Suggestions
results %>%
group_by(workshop) %>%
select(workshop, suggest_topics.post) %>%
drop_na()
Number of responses
#| message: false
#| warning: false
library(tidyverse)
library(bslib)
library(shiny)
library(bsicons)
source("scripts/helper_functions.R")
# list of workshop IDs to filter results
workshops <- c("2025-01-23-ucsb-geospatial")
results <- read_csv("data-joined/all_workshops.csv") %>%
filter(workshop %in% workshops)
# Fix comma separator
results <- results %>%
mutate(findout_select.pre = str_replace_all(
findout_select.pre,
"Twitter, Facebook, etc.",
"Twitter; Facebook; etc."))
pre_survey <- results %>%
select(ends_with(".pre"))
post_survey <- results %>%
select(ends_with(".post"))
shoreline <- read_csv("data/shoreline/2025-01-23-ucsb-geospatial-shoreline.csv") %>%
filter(`RSVP'ed`=='Yes')
n_pre <- sum(apply(post_survey, 1, function(row) all(is.na(row))))
n_post <- sum(apply(pre_survey, 1, function(row) all(is.na(row))))
n_total <- nrow(results)
n_both <- nrow(results) - n_pre - n_post
layout_columns(
value_box(
title = "RSVP'ed Yes - Shoreline", value = nrow(shoreline), ,
theme = NULL, showcase = bs_icon("card-checklist"), showcase_layout = "left center",
full_screen = FALSE, fill = TRUE, height = NULL
),
value_box(
title = "Total survey responses", value = n_total, ,
theme = NULL, showcase = bs_icon("people-fill"), showcase_layout = "left center",
full_screen = FALSE, fill = TRUE, height = NULL
),
value_box(
title = "Both pre- and post-", value = n_both, , theme = NULL,
showcase = bs_icon("arrows-expand-vertical"), showcase_layout = "left center",
full_screen = FALSE, fill = TRUE, height = NULL
),
value_box(
title = "Only pre-workshop", value = n_pre, ,
theme = NULL, showcase = bs_icon("arrow-left-short"), showcase_layout = "left center",
full_screen = FALSE, fill = TRUE, height = NULL
),
value_box(
title = "Only post-workshop", value = n_post, , theme = NULL,
showcase = bs_icon("arrow-right-short"), showcase_layout = "left center",
full_screen = FALSE, fill = TRUE, height = NULL
)
)
Departments (Shoreline info)
#| message: false
#| warning: false
name_var <- shoreline %>% select(starts_with("Please")) %>% names()
depts_2 <- shoreline %>% rename(dept_select.pre = name_var) %>%
  select(dept_select.pre) %>%
  separate_rows(dept_select.pre, sep=",") %>%
  mutate(dept_select.pre = str_trim(dept_select.pre)) %>%
  count(dept_select.pre, name = "count") %>%
  mutate(percent = (count / nrow(shoreline)) * 100,
         text = sprintf("%.0f (%.0f%%)", count, percent))

ggplot(depts_2, aes(y=reorder(dept_select.pre, count), x=count)) +
    geom_col() +
    geom_label(aes(label = text, hjust = -0.1),
               size = 3) +
    labs(x = "# respondents", y = element_blank()) +
    theme_minimal() +
    theme(
      panel.grid.minor = element_blank(),
      panel.grid.major.y = element_blank()
      ) +
    expand_limits(x = c(0,max(depts_2$count)*1.1))
Current occupation / Career stage (Shoreline info)
#| message: false
name_var <- shoreline %>% select(starts_with("What is")) %>% names()
ocup_2 <- shoreline %>% rename(occupation.pre = name_var) %>%
  select(occupation.pre) %>%
  separate_rows(occupation.pre, sep=",") %>%
  mutate(occupation.pre = str_trim(occupation.pre)) %>%
  count(occupation.pre, name = "count") %>%
  mutate(percent = (count / nrow(shoreline)) * 100,
         text = sprintf("%.0f (%.0f%%)", count, percent))

ggplot(ocup_2, aes(y=reorder(occupation.pre, count), x=count)) +
    geom_col() +
    geom_label(aes(label = text, hjust = -0.1),
               size = 3) +
    labs(x = "# respondents", y = element_blank()) +
    theme_minimal() +
    theme(
      panel.grid.minor = element_blank(),
      panel.grid.major.y = element_blank()
      ) +
    expand_limits(x = c(0,max(ocup_2$count)*1.2))
Motivation - Why are you participating in this workshop?
motiv <- results %>% select(motivation_select.pre) %>%
  separate_rows(motivation_select.pre, sep=",")  %>%
  mutate(motivation_select.pre = str_trim(motivation_select.pre)) %>%
  count(motivation_select.pre, name = "count") %>%
  drop_na() %>%
  mutate(percent = (count / (n_total - n_post)) * 100,
         text = sprintf("%.0f (%.0f%%)", count, percent))

ggplot(motiv, aes(y=reorder(motivation_select.pre, count), x=count)) +
    geom_col() +
    geom_label(aes(label = text, hjust = -0.1),
               size = 3) +
    labs(x = "# respondents", y = element_blank()) +
    theme_minimal() +
    theme(
      panel.grid.minor = element_blank(),
      panel.grid.major.y = element_blank()
      ) +
    expand_limits(x = c(0,max(motiv$count)*1.2))
How did you find out about this workshop?
findw <- results %>% select(findout_select.pre) %>%
  separate_rows(findout_select.pre, sep=",")  %>%
  mutate(findout_select.pre = str_trim(findout_select.pre)) %>%
  count(findout_select.pre, name = "count") %>%
  drop_na() %>%
  mutate(percent = (count / (n_total - n_post)) * 100,
         text = sprintf("%.0f (%.0f%%)", count, percent))

ggplot(findw, aes(y=reorder(findout_select.pre, count), x=count)) +
    geom_col() +
    geom_label(aes(label = text, hjust = -0.1),
               size = 3) +
    labs(x = "# respondents", y = element_blank()) +
    theme_minimal() +
    theme(
      panel.grid.minor = element_blank(),
      panel.grid.major.y = element_blank()
      ) +
    expand_limits(x = c(0,max(findw$count)*1.2))
What you most hope to learn?
results %>% group_by(workshop) %>%
  select(workshop, hopes.pre) %>%
  drop_na()
Learning environment in the workshop
#| message: false
#| output: false
orderedq <- c("Strongly Disagree", "Somewhat Disagree", "Neither Agree or Disagree","Somewhat Agree", "Strongly Agree")
addNA(orderedq)agree_questions <- results %>%
select(join_key, agree_apply.post, agree_comfortable.post, agree_clearanswers.post,
agree_instr_enthusiasm.post, agree_instr_interaction.post, agree_instr_knowledge.post
) %>%
filter(!if_all(-join_key, is.na))
n_agree_questions <- nrow(agree_questions)
agree_questions <- agree_questions %>%
pivot_longer(cols = -join_key, names_to = "Question", values_to = "Response") %>%
mutate(Response = factor(Response, levels = orderedq),
Question = recode(Question,
"agree_apply.post" = "Can immediatly apply
what they learned",
"agree_comfortable.post" = "Comfortable learning in
the workshop environment",
"agree_clearanswers.post" = "Got clear answers
from instructors",
"agree_instr_enthusiasm.post" = "Instructors were enthusiastic",
"agree_instr_interaction.post" = "Comfortable interacting
with instructors",
"agree_instr_knowledge.post" = "Instructors were knowledgeable
about the material"
))
summary_data <- agree_questions %>%
count(Question, Response, name = "count") %>%
mutate(percent = (count / n_agree_questions) * 100,
text = sprintf("%.0f (%.0f%%)", count, percent))
ggplot(summary_data, aes(x = Question, y = count, fill = Response)) +
geom_col(position = "fill", color = "black", show.legend = TRUE) +
scale_y_continuous(labels = scales::percent_format()) +
scale_fill_manual(values = c("Strongly Disagree" = "#d01c8b",
"Somewhat Disagree" = "#f1b6da",
"Neither Agree or Disagree" = "#f7f7f7",
"Somewhat Agree" = "#b8e186",
"Strongly Agree" = "#4dac26"),
na.translate = TRUE, na.value = "#cccccc",
breaks = orderedq, drop = FALSE) +
geom_text(aes(label = text), size = 3,
position = position_fill(vjust = 0.5)) +
labs(y = "# respondents (Percentage)", x = element_blank(), fill = "Responses",
subtitle = paste0("Number of responses: ", n_agree_questions)) +
theme_minimal() +
theme(axis.text.x = element_text(angle = 45, hjust = 1),
plot.subtitle = element_text(hjust = 0.5, size = 12))
How an instructor or helper affected your learning experience
#| message: false
results %>%
  group_by(workshop) %>%
  select(workshop, instructor_example.post) %>%
  drop_na()
Skills and perception comparison
# Calculate mean scores and make graph for all respondents (only_matched=FALSE)
tryCatch(
  {
mean_nresp <- get_mean_scores_nresp(results, only_matched=FALSE)
graph_pre_post(mean_nresp$mean_scores, mean_nresp$n_resp_pre, mean_nresp$n_resp_post, mean_nresp$n_resp_pre_post, only_matched=FALSE)
},
error = function(cond) {
message("Could not do the plots as there are no pre or post results to show")
}
)
# Calculate mean scores and make graph for only matched respondents in pre and post (only_matched=TRUE)
tryCatch(
  {
mean_nresp <- get_mean_scores_nresp(results, only_matched=TRUE)
graph_pre_post(mean_nresp$mean_scores, mean_nresp$n_resp_pre, mean_nresp$n_resp_post, mean_nresp$n_resp_pre_post, only_matched=TRUE)
},
error = function(cond) {
message("Could not do the plots as there are no pre or post results to show")
}
)
Workshop Strengths
results %>%
  group_by(workshop) %>%
  select(workshop, workshop_strengths.post) %>%
  drop_na()
Ways to improve the workshop
results %>%
  group_by(workshop) %>%
  select(workshop, workshop_improved.post) %>%
  drop_na()
How likely are you to recommend this workshop? Scale 0 - 10
orderedq <- c("Detractor", "Passive", "Promoter")

nps <- results %>%
  count(recommend_group.post, recommende_score.post, name = "count") %>%
  drop_na() %>%
  mutate(recommend_group.post = factor(recommend_group.post, levels = orderedq),
         percent = (count/sum(count)) * 100,
         text = sprintf("%.0f (%.0f%%)", count, percent))

nps %>%
ggplot(aes(x=recommende_score.post, y=count, fill=recommend_group.post)) +
  geom_col(color="black", show.legend = TRUE) +
  scale_fill_manual(values = c("Detractor" = "#af8dc3", "Passive" = "#f7f7f7", "Promoter" = "#7fbf7b"), breaks = c("Detractor", "Passive", "Promoter"), drop = FALSE) +
  geom_label(aes(label = text, vjust = -0.5), fill = "white", size= 3) +
  scale_x_continuous(breaks = 1:10) +
  labs(x = "NPS Score", y = "# respondents", subtitle = paste0("Number of responses: ", sum(nps$count), "
 Mean score: ", format(weighted.mean(nps$recommende_score.post, nps$count), digits = 3))) +
  theme_minimal() +
  theme(
    panel.grid.minor = element_blank(),
    panel.grid.major.x = element_blank(),
    plot.subtitle = element_text(hjust = 0.5, size = 12)
  ) +
  expand_limits(x = c(1,10),
                y = c(0, max(nps$count)*1.1))
Topic Suggestions
results %>%
  group_by(workshop) %>%
  select(workshop, suggest_topics.post) %>%
  drop_na()
Number of responses
#| message: false
#| warning: false
library(tidyverse)
library(bslib)
library(shiny)
library(bsicons)
source("scripts/helper_functions.R")
# list of workshop IDs to filter results
workshops <- c("2025-02-03-ucsb-computing")
results <- read_csv("data-joined/all_workshops.csv") %>%
filter(workshop %in% workshops)
# Fix comma separator
results <- results %>%
mutate(findout_select.pre = str_replace_all(
findout_select.pre,
"Twitter, Facebook, etc.",
"Twitter; Facebook; etc."))
pre_survey <- results %>%
select(ends_with(".pre"))
post_survey <- results %>%
select(ends_with(".post"))
shoreline <- read_csv("data/shoreline/2025-02-03-ucsb-computing-shoreline.csv") %>%
filter(`RSVP'ed`=='Yes')
n_pre <- sum(apply(post_survey, 1, function(row) all(is.na(row))))
n_post <- sum(apply(pre_survey, 1, function(row) all(is.na(row))))
n_total <- nrow(results)
n_both <- nrow(results) - n_pre - n_post
layout_columns(
value_box(
title = "RSVP'ed Yes - Shoreline", value = nrow(shoreline), ,
theme = NULL, showcase = bs_icon("card-checklist"), showcase_layout = "left center",
full_screen = FALSE, fill = TRUE, height = NULL
),
value_box(
title = "Total survey responses", value = n_total, ,
theme = NULL, showcase = bs_icon("people-fill"), showcase_layout = "left center",
full_screen = FALSE, fill = TRUE, height = NULL
),
value_box(
title = "Both pre- and post-", value = n_both, , theme = NULL,
showcase = bs_icon("arrows-expand-vertical"), showcase_layout = "left center",
full_screen = FALSE, fill = TRUE, height = NULL
),
value_box(
title = "Only pre-workshop", value = n_pre, ,
theme = NULL, showcase = bs_icon("arrow-left-short"), showcase_layout = "left center",
full_screen = FALSE, fill = TRUE, height = NULL
),
value_box(
title = "Only post-workshop", value = n_post, , theme = NULL,
showcase = bs_icon("arrow-right-short"), showcase_layout = "left center",
full_screen = FALSE, fill = TRUE, height = NULL
)
)
Departments (Shoreline info)
#| message: false
#| warning: false
name_var <- shoreline %>% select(starts_with("Please")) %>% names()
depts_2 <- shoreline %>% rename(dept_select.pre = name_var) %>%
select(dept_select.pre) %>%
separate_rows(dept_select.pre, sep=",") %>%
mutate(dept_select.pre = str_trim(dept_select.pre)) %>%
count(dept_select.pre, name = "count") %>%
mutate(percent = (count / nrow(shoreline)) * 100,
text = sprintf("%.0f (%.0f%%)", count, percent))
ggplot(depts_2, aes(y=reorder(dept_select.pre, count), x=count)) +
geom_col() +
geom_label(aes(label = text, hjust = -0.1),
size = 3) +
labs(x = "# respondents", y = element_blank()) +
theme_minimal() +
theme(
panel.grid.minor = element_blank(),
panel.grid.major.y = element_blank()
) +
expand_limits(x = c(0,max(depts_2$count)*1.1))
Current occupation / Career stage (Shoreline info)
#| message: false
name_var <- shoreline %>% select(starts_with("What is")) %>% names()
ocup_2 <- shoreline %>% rename(occupation.pre = name_var) %>%
select(occupation.pre) %>%
separate_rows(occupation.pre, sep=",") %>%
mutate(occupation.pre = str_trim(occupation.pre)) %>%
count(occupation.pre, name = "count") %>%
mutate(percent = (count / nrow(shoreline)) * 100,
text = sprintf("%.0f (%.0f%%)", count, percent))
ggplot(ocup_2, aes(y=reorder(occupation.pre, count), x=count)) +
geom_col() +
geom_label(aes(label = text, hjust = -0.1),
size = 3) +
labs(x = "# respondents", y = element_blank()) +
theme_minimal() +
theme(
panel.grid.minor = element_blank(),
panel.grid.major.y = element_blank()
) +
expand_limits(x = c(0,max(ocup_2$count)*1.2))
Motivation - Why are you participating in this workshop?
motiv <- results %>% select(motivation_select.pre) %>%
separate_rows(motivation_select.pre, sep=",") %>%
mutate(motivation_select.pre = str_trim(motivation_select.pre)) %>%
count(motivation_select.pre, name = "count") %>%
drop_na() %>%
mutate(percent = (count / (n_total - n_post)) * 100,
text = sprintf("%.0f (%.0f%%)", count, percent))
ggplot(motiv, aes(y=reorder(motivation_select.pre, count), x=count)) +
geom_col() +
geom_label(aes(label = text, hjust = -0.1),
size = 3) +
labs(x = "# respondents", y = element_blank()) +
theme_minimal() +
theme(
panel.grid.minor = element_blank(),
panel.grid.major.y = element_blank()
) +
expand_limits(x = c(0,max(motiv$count)*1.2))
How did you find out about this workshop?
findw <- results %>% select(findout_select.pre) %>%
separate_rows(findout_select.pre, sep=",") %>%
mutate(findout_select.pre = str_trim(findout_select.pre)) %>%
count(findout_select.pre, name = "count") %>%
drop_na() %>%
mutate(percent = (count / (n_total - n_post)) * 100,
text = sprintf("%.0f (%.0f%%)", count, percent))
ggplot(findw, aes(y=reorder(findout_select.pre, count), x=count)) +
geom_col() +
geom_label(aes(label = text, hjust = -0.1),
size = 3) +
labs(x = "# respondents", y = element_blank()) +
theme_minimal() +
theme(
panel.grid.minor = element_blank(),
panel.grid.major.y = element_blank()
) +
expand_limits(x = c(0,max(findw$count)*1.2))
What you most hope to learn?
results %>% group_by(workshop) %>%
select(workshop, hopes.pre) %>%
drop_na()
Learning environment in the workshop
#| message: false
#| output: false
orderedq <- c("Strongly Disagree", "Somewhat Disagree", "Neither Agree or Disagree","Somewhat Agree", "Strongly Agree")
addNA(orderedq)agree_questions <- results %>%
select(join_key, agree_apply.post, agree_comfortable.post, agree_clearanswers.post,
agree_instr_enthusiasm.post, agree_instr_interaction.post, agree_instr_knowledge.post
) %>%
filter(!if_all(-join_key, is.na))
n_agree_questions <- nrow(agree_questions)
agree_questions <- agree_questions %>%
pivot_longer(cols = -join_key, names_to = "Question", values_to = "Response") %>%
mutate(Response = factor(Response, levels = orderedq),
Question = recode(Question,
"agree_apply.post" = "Can immediatly apply
what they learned",
"agree_comfortable.post" = "Comfortable learning in
the workshop environment",
"agree_clearanswers.post" = "Got clear answers
from instructors",
"agree_instr_enthusiasm.post" = "Instructors were enthusiastic",
"agree_instr_interaction.post" = "Comfortable interacting
with instructors",
"agree_instr_knowledge.post" = "Instructors were knowledgeable
about the material"
))
summary_data <- agree_questions %>%
count(Question, Response, name = "count") %>%
mutate(percent = (count / n_agree_questions) * 100,
text = sprintf("%.0f (%.0f%%)", count, percent))
ggplot(summary_data, aes(x = Question, y = count, fill = Response)) +
geom_col(position = "fill", color = "black", show.legend = TRUE) +
scale_y_continuous(labels = scales::percent_format()) +
scale_fill_manual(values = c("Strongly Disagree" = "#d01c8b",
"Somewhat Disagree" = "#f1b6da",
"Neither Agree or Disagree" = "#f7f7f7",
"Somewhat Agree" = "#b8e186",
"Strongly Agree" = "#4dac26"),
na.translate = TRUE, na.value = "#cccccc",
breaks = orderedq, drop = FALSE) +
geom_text(aes(label = text), size = 3,
position = position_fill(vjust = 0.5)) +
labs(y = "# respondents (Percentage)", x = element_blank(), fill = "Responses",
subtitle = paste0("Number of responses: ", n_agree_questions)) +
theme_minimal() +
theme(axis.text.x = element_text(angle = 45, hjust = 1),
plot.subtitle = element_text(hjust = 0.5, size = 12))
How an instructor or helper affected your learning experience
#| message: false
results %>%
group_by(workshop) %>%
select(workshop, instructor_example.post) %>%
drop_na()
Skills and perception comparison
# Calculate mean scores and make graph for all respondents (only_matched=FALSE)
tryCatch(
{
mean_nresp <- get_mean_scores_nresp(results, only_matched=FALSE)
graph_pre_post(mean_nresp$mean_scores, mean_nresp$n_resp_pre, mean_nresp$n_resp_post, mean_nresp$n_resp_pre_post, only_matched=FALSE)
},
error = function(cond) {
message("Could not do the plots as there are no pre or post results to show")
}
)
# Calculate mean scores and make graph for only matched respondents in pre and post (only_matched=TRUE)
tryCatch(
{
mean_nresp <- get_mean_scores_nresp(results, only_matched=TRUE)
graph_pre_post(mean_nresp$mean_scores, mean_nresp$n_resp_pre, mean_nresp$n_resp_post, mean_nresp$n_resp_pre_post, only_matched=TRUE)
},
error = function(cond) {
message("Could not do the plots as there are no pre or post results to show")
}
)
Workshop Strengths
results %>%
group_by(workshop) %>%
select(workshop, workshop_strengths.post) %>%
drop_na()
Ways to improve the workshop
results %>%
group_by(workshop) %>%
select(workshop, workshop_improved.post) %>%
drop_na()
How likely are you to recommend this workshop? Scale 0 - 10
orderedq <- c("Detractor", "Passive", "Promoter")
nps <- results %>%
count(recommend_group.post, recommende_score.post, name = "count") %>%
drop_na() %>%
mutate(recommend_group.post = factor(recommend_group.post, levels = orderedq),
percent = (count/sum(count)) * 100,
text = sprintf("%.0f (%.0f%%)", count, percent))
nps %>%
ggplot(aes(x=recommende_score.post, y=count, fill=recommend_group.post)) +
geom_col(color="black", show.legend = TRUE) +
scale_fill_manual(values = c("Detractor" = "#af8dc3", "Passive" = "#f7f7f7", "Promoter" = "#7fbf7b"), breaks = c("Detractor", "Passive", "Promoter"), drop = FALSE) +
geom_label(aes(label = text, vjust = -0.5), fill = "white", size= 3) +
scale_x_continuous(breaks = 1:10) +
labs(x = "NPS Score", y = "# respondents", subtitle = paste0("Number of responses: ", sum(nps$count), "
Mean score: ", format(weighted.mean(nps$recommende_score.post, nps$count), digits = 3))) +
theme_minimal() +
theme(
panel.grid.minor = element_blank(),
panel.grid.major.x = element_blank(),
plot.subtitle = element_text(hjust = 0.5, size = 12)
) +
expand_limits(x = c(1,10),
y = c(0, max(nps$count)*1.1))
Topic Suggestions
results %>%
group_by(workshop) %>%
select(workshop, suggest_topics.post) %>%
drop_na()
Number of responses
#| message: false
library(tidyverse)
library(bslib)
library(shiny)
library(bsicons)
source("scripts/helper_functions.R")
# list of workshop IDs to filter results
workshops <- c("2025-01-23-ucsb-geospatial", "2025-01-15-ucsb-containers", "2025-01-14-ucsb-python, 2025-02-03-ucsb-computing")
results <- read_csv("data-joined/all_workshops.csv") %>%
filter(workshop %in% workshops)
# Fix comma separator
results <- results %>%
mutate(findout_select.pre = str_replace_all(
findout_select.pre,
"Twitter, Facebook, etc.",
"Twitter; Facebook; etc."))
pre_survey <- results %>%
select(ends_with(".pre"))
post_survey <- results %>%
select(ends_with(".post"))
n_pre <- sum(apply(post_survey, 1, function(row) all(is.na(row))))
n_post <- sum(apply(pre_survey, 1, function(row) all(is.na(row))))
n_total <- nrow(results)
n_both <- nrow(results) - n_pre - n_post
layout_columns(
value_box(
title = "Total responses", value = n_total, ,
theme = NULL, showcase = bs_icon("people-fill"), showcase_layout = "left center",
full_screen = FALSE, fill = TRUE, height = NULL
),
value_box(
title = "Both pre- and post-", value = n_both, , theme = NULL,
showcase = bs_icon("arrows-expand-vertical"), showcase_layout = "left center",
full_screen = FALSE, fill = TRUE, height = NULL
),
value_box(
title = "Only pre-workshop", value = n_pre, ,
theme = NULL, showcase = bs_icon("arrow-left-short"), showcase_layout = "left center",
full_screen = FALSE, fill = TRUE, height = NULL
),
value_box(
title = "Only post-workshop", value = n_post, , theme = NULL,
showcase = bs_icon("arrow-right-short"), showcase_layout = "left center",
full_screen = FALSE, fill = TRUE, height = NULL
)
)
Departments
depts <- results %>% select(dept_select.pre) %>%
  separate_rows(dept_select.pre, sep=",") %>%
  mutate(dept_select.pre = str_trim(dept_select.pre)) %>%
  count(dept_select.pre, name = "count") %>%
  mutate(percent = (count / (n_total - n_post)) * 100,
         text = sprintf("%.0f (%.0f%%)", count, percent))

ggplot(depts, aes(y=reorder(dept_select.pre, count), x=count)) +
    geom_col() +
    geom_label(aes(label = text, hjust = -0.1),
               size = 3) +
    labs(x = "# respondents", y = element_blank()) +
    theme_minimal() +
    theme(
      panel.grid.minor = element_blank(),
      panel.grid.major.y = element_blank()
      ) +
    expand_limits(x = c(0,max(depts$count)*1.1))
“Other” Departments
other_depts <- results %>%
  count(dept_other.pre, name = "count") %>%
  drop_na() %>%
  mutate(percent = (count / (n_total - n_post)) * 100,
         text = sprintf("%.0f (%.0f%%)", count, percent))

ggplot(other_depts, aes(y=reorder(dept_other.pre, count), x=count)) +
    geom_col() +
    geom_label(aes(label = text, hjust = -0.1),
               size = 3) +
    labs(x = "# respondents", y = element_blank()) +
    theme_minimal() +
    theme(
      panel.grid.minor = element_blank(),
      panel.grid.major.y = element_blank()
      ) +
    expand_limits(x = c(0,max(other_depts$count)*1.1))
Current occupation / Career stage
ocup <- results %>% select(occupation.pre) %>%
  separate_rows(occupation.pre, sep=",") %>%
  mutate(occupation.pre = str_trim(occupation.pre)) %>%
  count(occupation.pre, name = "count") %>%
  drop_na() %>%
  mutate(percent = (count / (n_total - n_post)) * 100,
         text = sprintf("%.0f (%.0f%%)", count, percent))

ggplot(ocup, aes(y=reorder(occupation.pre, count), x=count)) +
    geom_col() +
    geom_label(aes(label = text, hjust = -0.1),
               size = 3) +
    labs(x = "# respondents", y = element_blank()) +
    theme_minimal() +
    theme(
      panel.grid.minor = element_blank(),
      panel.grid.major.y = element_blank()
      ) +
    expand_limits(x = c(0,max(ocup$count)*1.2))
Motivation - Why are you participating in this workshop?
motiv <- results %>% select(motivation_select.pre) %>%
  separate_rows(motivation_select.pre, sep=",")  %>%
  mutate(motivation_select.pre = str_trim(motivation_select.pre)) %>%
  count(motivation_select.pre, name = "count") %>%
  drop_na() %>%
  mutate(percent = (count / (n_total - n_post)) * 100,
         text = sprintf("%.0f (%.0f%%)", count, percent))

ggplot(motiv, aes(y=reorder(motivation_select.pre, count), x=count)) +
    geom_col() +
    geom_label(aes(label = text, hjust = -0.1),
               size = 3) +
    labs(x = "# respondents", y = element_blank()) +
    theme_minimal() +
    theme(
      panel.grid.minor = element_blank(),
      panel.grid.major.y = element_blank()
      ) +
    expand_limits(x = c(0,max(motiv$count)*1.2))
How did you find out about this workshop?
findw <- results %>% select(findout_select.pre) %>%
  separate_rows(findout_select.pre, sep=",")  %>%
  mutate(findout_select.pre = str_trim(findout_select.pre)) %>%
  count(findout_select.pre, name = "count") %>%
  drop_na() %>%
  mutate(percent = (count / (n_total - n_post)) * 100,
         text = sprintf("%.0f (%.0f%%)", count, percent))

ggplot(findw, aes(y=reorder(findout_select.pre, count), x=count)) +
    geom_col() +
    geom_label(aes(label = text, hjust = -0.1),
               size = 3) +
    labs(x = "# respondents", y = element_blank()) +
    theme_minimal() +
    theme(
      panel.grid.minor = element_blank(),
      panel.grid.major.y = element_blank()
      ) +
    expand_limits(x = c(0,max(findw$count)*1.2))
What you most hope to learn?
results %>% group_by(workshop) %>%
  select(workshop, hopes.pre) %>%
  drop_na()
Learning environment in the workshop
#| message: false
#| output: false
orderedq <- c("Strongly Disagree", "Somewhat Disagree", "Neither Agree or Disagree","Somewhat Agree", "Strongly Agree")
addNA(orderedq)
agree_questions <- results %>%
select(join_key, agree_apply.post, agree_comfortable.post, agree_clearanswers.post,
agree_instr_enthusiasm.post, agree_instr_interaction.post, agree_instr_knowledge.post
) %>%
filter(!if_all(-join_key, is.na))
n_agree_questions <- nrow(agree_questions)
agree_questions <- agree_questions %>%
pivot_longer(cols = -join_key, names_to = "Question", values_to = "Response") %>%
mutate(Response = factor(Response, levels = orderedq),
Question = recode(Question,
"agree_apply.post" = "Can immediatly apply
what they learned",
"agree_comfortable.post" = "Comfortable learning in
the workshop environment",
"agree_clearanswers.post" = "Got clear answers
from instructors",
"agree_instr_enthusiasm.post" = "Instructors were enthusiastic",
"agree_instr_interaction.post" = "Comfortable interacting
with instructors",
"agree_instr_knowledge.post" = "Instructors were knowledgeable
about the material"
))
summary_data <- agree_questions %>%
count(Question, Response, name = "count") %>%
mutate(percent = (count / n_agree_questions) * 100,
text = sprintf("%.0f (%.0f%%)", count, percent))
ggplot(summary_data, aes(x = Question, y = count, fill = Response)) +
geom_col(position = "fill", color = "black", show.legend = TRUE) +
scale_y_continuous(labels = scales::percent_format()) +
scale_fill_manual(values = c("Strongly Disagree" = "#d01c8b",
"Somewhat Disagree" = "#f1b6da",
"Neither Agree or Disagree" = "#f7f7f7",
"Somewhat Agree" = "#b8e186",
"Strongly Agree" = "#4dac26"),
na.translate = TRUE, na.value = "#cccccc",
breaks = orderedq, drop = FALSE) +
geom_text(aes(label = text), size = 3,
position = position_fill(vjust = 0.5)) +
labs(y = "# respondents (Percentage)", x = element_blank(), fill = "Responses",
subtitle = paste0("Number of responses: ", n_agree_questions)) +
theme_minimal() +
theme(axis.text.x = element_text(angle = 45, hjust = 1),
plot.subtitle = element_text(hjust = 0.5, size = 12))
How an instructor or helper affected your learning experience
#| message: false
results %>%
  group_by(workshop) %>%
  select(workshop, instructor_example.post) %>%
  drop_na()
Skills and perception comparison
# Calculate mean scores and make graph for all respondents (only_matched=FALSE)
tryCatch(
  {
mean_nresp <- get_mean_scores_nresp(results, only_matched=FALSE)
graph_pre_post(mean_nresp$mean_scores, mean_nresp$n_resp_pre, mean_nresp$n_resp_post, mean_nresp$n_resp_pre_post, only_matched=FALSE)
},
error = function(cond) {
message("Could not do the plots as there are no pre or post results to show")
}
)
# Calculate mean scores and make graph for only matched respondents in pre and post (only_matched=TRUE)
tryCatch(
  {
mean_nresp <- get_mean_scores_nresp(results, only_matched=TRUE)
graph_pre_post(mean_nresp$mean_scores, mean_nresp$n_resp_pre, mean_nresp$n_resp_post, mean_nresp$n_resp_pre_post, only_matched=TRUE)
},
error = function(cond) {
message("Could not do the plots as there are no pre or post results to show")
}
)
Workshop Strengths
results %>%
  group_by(workshop) %>%
  select(workshop, workshop_strengths.post) %>%
  drop_na()
Ways to improve the workshop
results %>%
  group_by(workshop) %>%
  select(workshop, workshop_improved.post) %>%
  drop_na()
How likely are you to recommend this workshop? Scale 0 - 10
orderedq <- c("Detractor", "Passive", "Promoter")

nps <- results %>%
  count(recommend_group.post, recommende_score.post, name = "count") %>%
  drop_na() %>%
  mutate(recommend_group.post = factor(recommend_group.post, levels = orderedq),
         percent = (count/sum(count)) * 100,
         text = sprintf("%.0f (%.0f%%)", count, percent))

nps %>%
ggplot(aes(x=recommende_score.post, y=count, fill=recommend_group.post)) +
  geom_col(color="black", show.legend = TRUE) +
  scale_fill_manual(values = c("Detractor" = "#af8dc3", "Passive" = "#f7f7f7", "Promoter" = "#7fbf7b"), breaks = c("Detractor", "Passive", "Promoter"), drop = FALSE) +
  geom_label(aes(label = text, vjust = -0.5), fill = "white", size= 3) +
  scale_x_continuous(breaks = 1:10) +
  labs(x = "NPS Score", y = "# respondents", subtitle = paste0("Number of responses: ", sum(nps$count), "
 Mean score: ", format(weighted.mean(nps$recommende_score.post, nps$count), digits = 3))) +
  theme_minimal() +
  theme(
    panel.grid.minor = element_blank(),
    panel.grid.major.x = element_blank(),
    plot.subtitle = element_text(hjust = 0.5, size = 12)
  ) +
  expand_limits(x = c(1,10),
                y = c(0, max(nps$count)*1.1))
Topic Suggestions
results %>%
  group_by(workshop) %>%
  select(workshop, suggest_topics.post) %>%
  drop_na()
Report for all Winter 2025 workshops