I’m interested in learning how to process, analyze, and visualize geospatial data from remote sensors. Ultimately, I’m trying to build skills toward effectively gathering and processing multiband sonar data of near-shore bathymetry for visualization, analysis, and modeling phenomenon.
2025-01-23-ucsb-geospatial
Refresh skills in R and learn how to analyze spatial data
2025-01-23-ucsb-geospatial
the R language and data management environments like SQL
2025-01-23-ucsb-geospatial
Ability to handle high resolution spatial data within R
2025-01-23-ucsb-geospatial
how to maneuver Geospatial data
2025-01-23-ucsb-geospatial
I hope to become more confident in working with raster data. I am hoping that I can take what I learn during this workshop and make maps/figures using the information that I gain during the workshop.
2025-01-23-ucsb-geospatial
more on handling raster spatial data
2025-01-23-ucsb-geospatial
Confident in my skills :)
2025-01-23-ucsb-geospatial
I hope to learn a project based system on how to do data analytics
2025-01-23-ucsb-geospatial
To make maps in r without hating my data organization skills
2025-01-23-ucsb-geospatial
I hope to learn at least some basic skills that can help with geospatial data
2025-01-23-ucsb-geospatial
I hope to learn new skills and deepen my understanding of data structures and applications
2025-01-23-ucsb-geospatial
I hope to better my understanding of R especially as it relates to geographical analysis
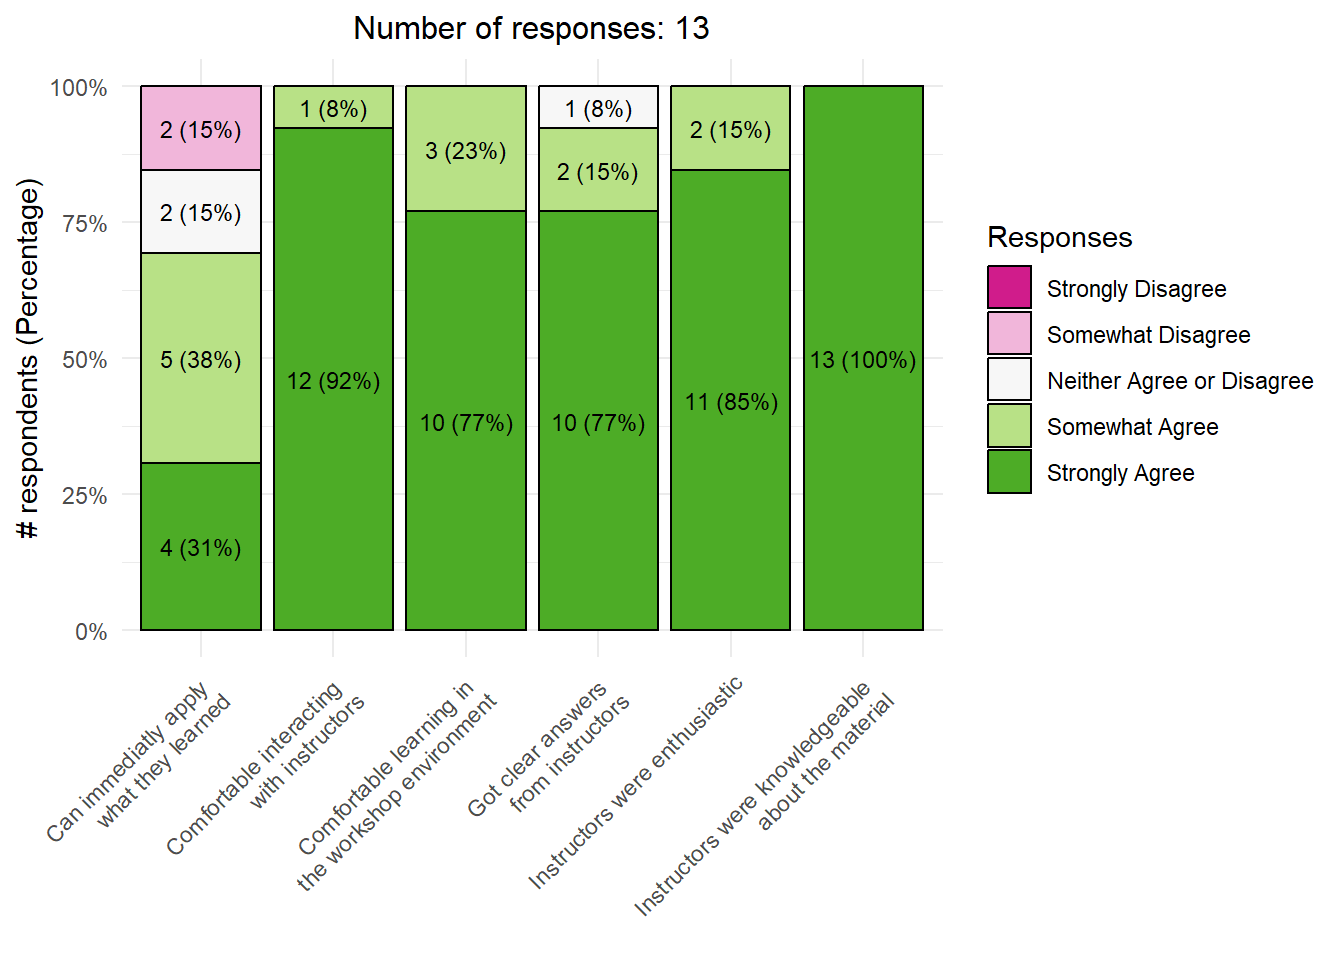
For somebody coming outside of the field of geospatial science, the instructors were helpful in communicating and relating geographic metadata and other concepts.
2025-01-23-ucsb-geospatial
Sigrid was great at addressing the comments we made on the purple and yellow stickies!
2025-01-23-ucsb-geospatial
Helped me whenever I put up the colored sticky note
2025-01-23-ucsb-geospatial
I ran into small issues with my code as a result of typing errors. Instructors were very helpful at identifying these errors and providing helpful tips along the way to avoid errors in the future
2025-01-23-ucsb-geospatial
Explaining commands
2025-01-23-ucsb-geospatial
They were extremely helpful and created a lighthearted learning environment. It was clear that they respect each other as well as the students. They did a fantastic job.
2025-01-23-ucsb-geospatial
hands on help(esp when things went wrong->stopped me from panicing and shutting down in frustration)
2025-01-23-ucsb-geospatial
They were all super attentitve and fast in providing help
2025-01-23-ucsb-geospatial
Great! Helping me determine what coding issues I was encountering rapidly.
2025-01-23-ucsb-geospatial
Plenty of people to offer one on one help so it was a very supportive and comfortable working environment that moved at a good slow pace for everyone too follow along. If I ever had trouble, I could put up a yellow sticky note and someone would come work with me to figure out my problem or catch up if I got behind.
2025-01-23-ucsb-geospatial
I didn’t show up the second to last day but when I came in the final day, one of the instructors got me all caught up on the code I needed which was super helpful
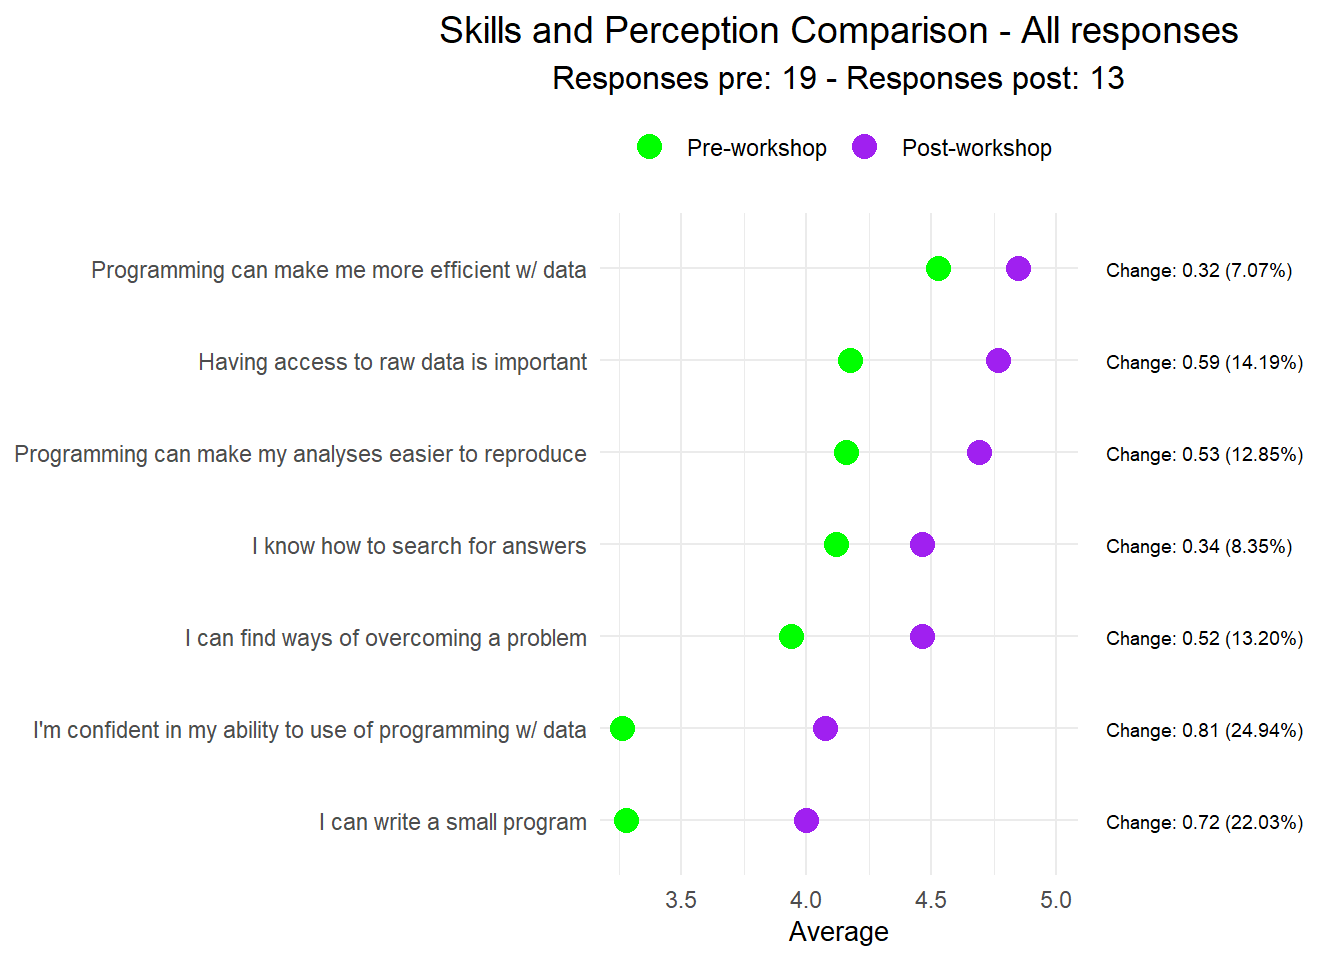
Skills and perception comparison
Code
# Calculate mean scores and make graph for all respondents (only_matched=FALSE)tryCatch( {mean_nresp <-get_mean_scores_nresp(results, only_matched=FALSE)graph_pre_post(mean_nresp$mean_scores, mean_nresp$n_resp_pre, mean_nresp$n_resp_post, mean_nresp$n_resp_pre_post, only_matched=FALSE)},error =function(cond) {message("Could not do the plots as there are no pre or post results to show")})
Code
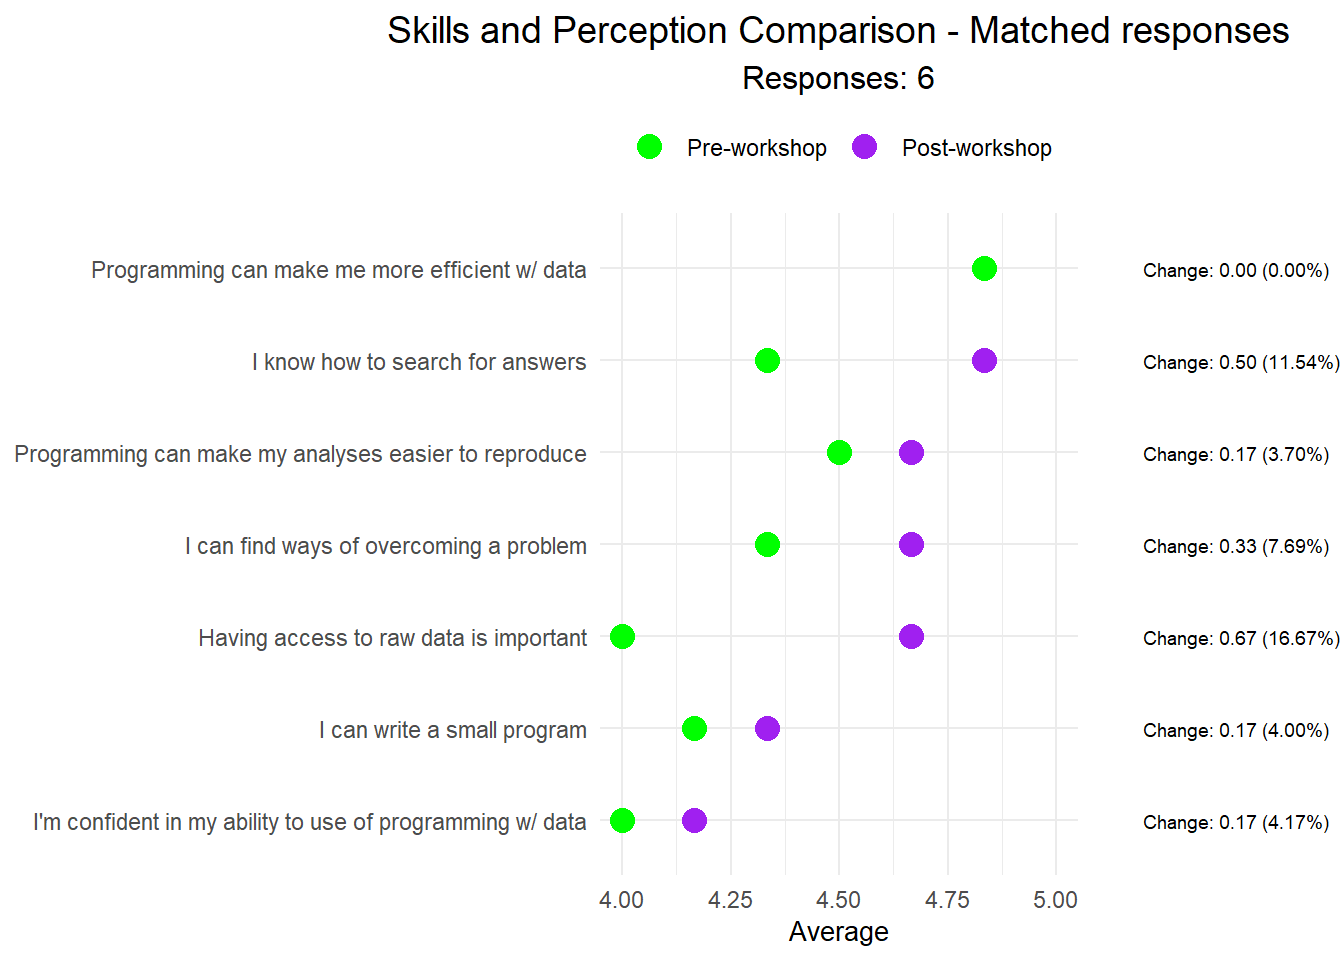
# Calculate mean scores and make graph for only matched respondents in pre and post (only_matched=TRUE)tryCatch( {mean_nresp <-get_mean_scores_nresp(results, only_matched=TRUE)graph_pre_post(mean_nresp$mean_scores, mean_nresp$n_resp_pre, mean_nresp$n_resp_post, mean_nresp$n_resp_pre_post, only_matched=TRUE)},error =function(cond) {message("Could not do the plots as there are no pre or post results to show")})
A lot of support throughout the workshop with the lecture and helpers
2025-01-23-ucsb-geospatial
Real-time communication with sticky note colors
2025-01-23-ucsb-geospatial
applicability
2025-01-23-ucsb-geospatial
Loved the sticky note system, it is much easier to stick a yellow note on your laptop than to interrupt and raise a hand. Loved the visual elements and direct applications during the workshop.
2025-01-23-ucsb-geospatial
i loved it all tbh
2025-01-23-ucsb-geospatial
helping us navigate step-by-step with the functions and building up from every episode. the way it was organized throughout 4 days really helped. Perhaps it could be spread out into more days even.
2025-01-23-ucsb-geospatial
Instructors & Pacing
2025-01-23-ucsb-geospatial
Lots of staff to help troubleshoot and interesting data. Also explored a variety of data types
2025-01-23-ucsb-geospatial
This workshop really helped me with ggplot. I know so much now
More information about data sets and information being visualized, and information about data collection techniques.
2025-01-23-ucsb-geospatial
Talk more about the data we are working with, what all of the standards mean, what plot are we actually making?
2025-01-23-ucsb-geospatial
I think more could be done to contextualize the data and explain the options of all of the function options. For example, in some ggplots, we added titles and subtitles, but I would appreciate a deeper explanation of all of the options, perhaps by making one very fancy graph
2025-01-23-ucsb-geospatial
More in-depth explanations of what is going on behind the scenes or detailed descriptions of rasters etc.
2025-01-23-ucsb-geospatial
more days:)
2025-01-23-ucsb-geospatial
I would consider adding one more day, the last day felt a bit rushed in the last part. Explain the functions in more details, for instance, why we are using a function in a certain line – sometimes this was said, but not often.
2025-01-23-ucsb-geospatial
More checkpoints through out the workshop
2025-01-23-ucsb-geospatial
Explain certain acronyms or functions a little better when we use them even if they were explained once a few days ago
2025-01-23-ucsb-geospatial
I think we should copy and paste code more often because it was a bit tedious especially with all the ggplot setup
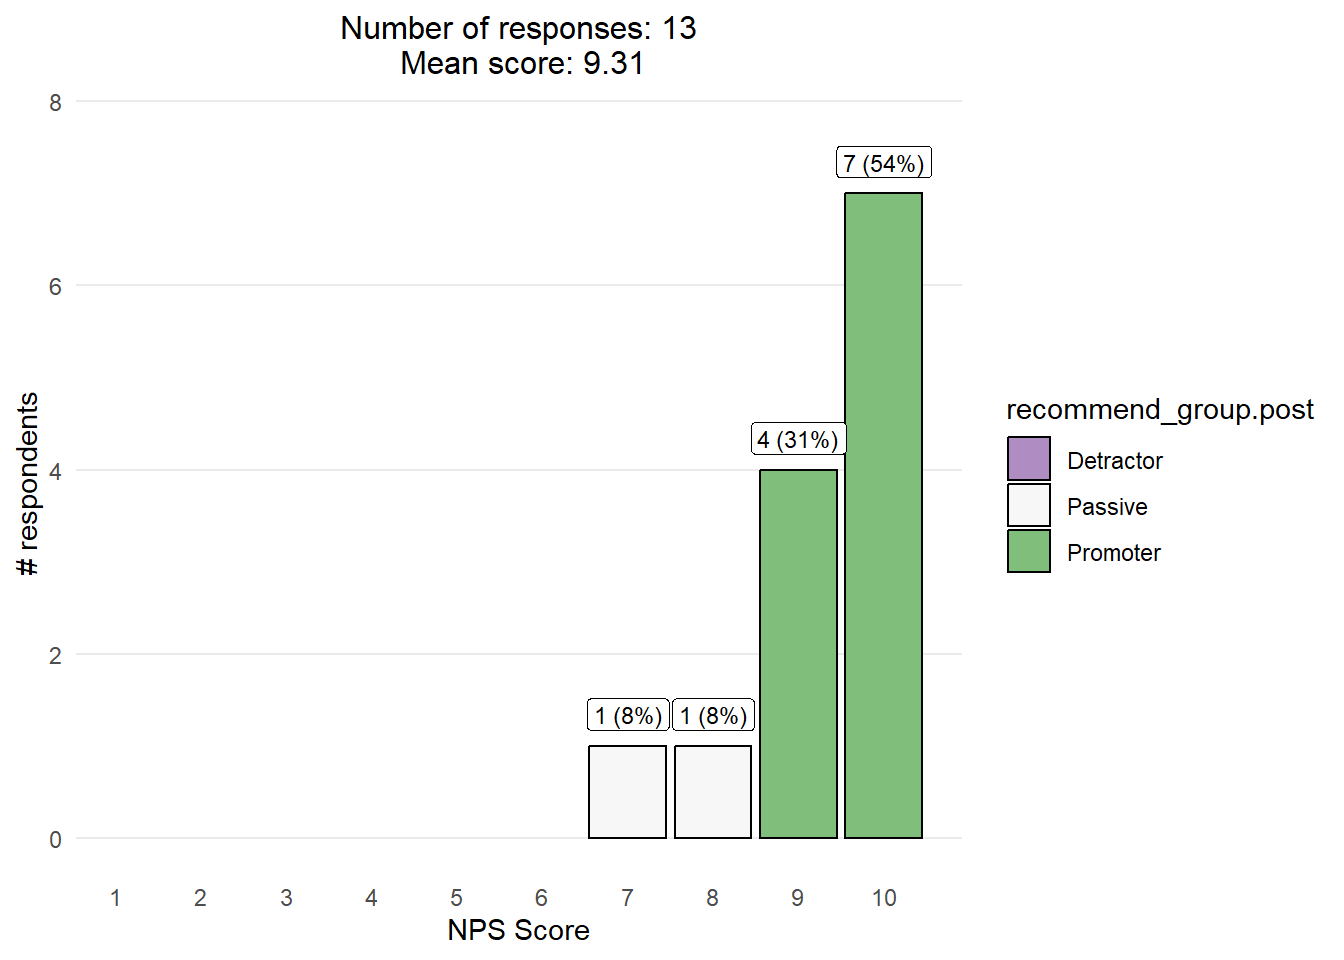
How likely are you to recommend this workshop? Scale 0 - 10
# Calculate mean scores and make graph for all respondents (only_matched=FALSE)
tryCatch(
  {
mean_nresp <- get_mean_scores_nresp(results, only_matched=FALSE)
graph_pre_post(mean_nresp$mean_scores, mean_nresp$n_resp_pre, mean_nresp$n_resp_post, mean_nresp$n_resp_pre_post, only_matched=FALSE)
},
error = function(cond) {
message("Could not do the plots as there are no pre or post results to show")
}
)
# Calculate mean scores and make graph for only matched respondents in pre and post (only_matched=TRUE)
tryCatch(
  {
mean_nresp <- get_mean_scores_nresp(results, only_matched=TRUE)
graph_pre_post(mean_nresp$mean_scores, mean_nresp$n_resp_pre, mean_nresp$n_resp_post, mean_nresp$n_resp_pre_post, only_matched=TRUE)
},
error = function(cond) {
message("Could not do the plots as there are no pre or post results to show")
}
)