Image 1 of 1: ‘Poorly fitted data’

Image 1 of 1: ‘Train and test set’

Image 1 of 1: ‘Model training’
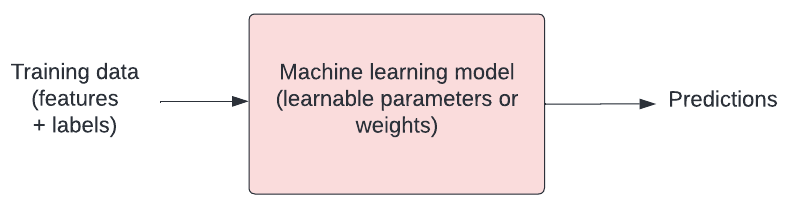
Image 1 of 1: ‘Distance from target’
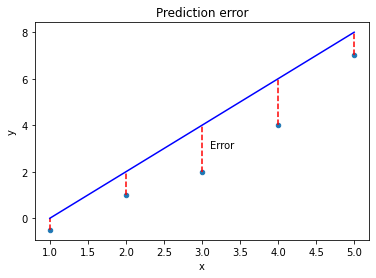
Image 1 of 1: ‘Mean squared error’
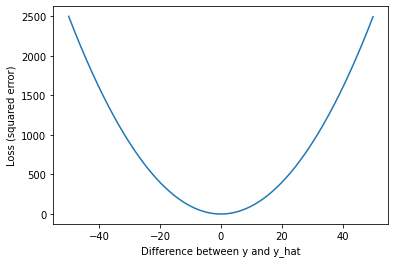
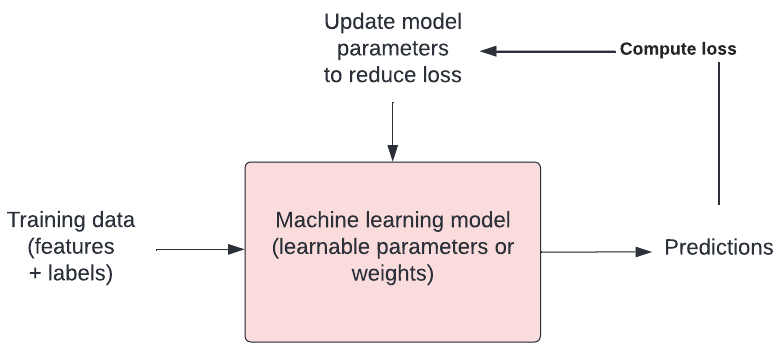
Image 1 of 1: ‘Model training’
Modellinguse a single feature (apache score)note: remove the reshape if fitting to >1 input variablefit the model to our dataget the y valuesplot
Image 1 of 1: ‘Sigmoid function’

Image 1 of 1: ‘Logistic regression’
You should see a plot similar to the one below: 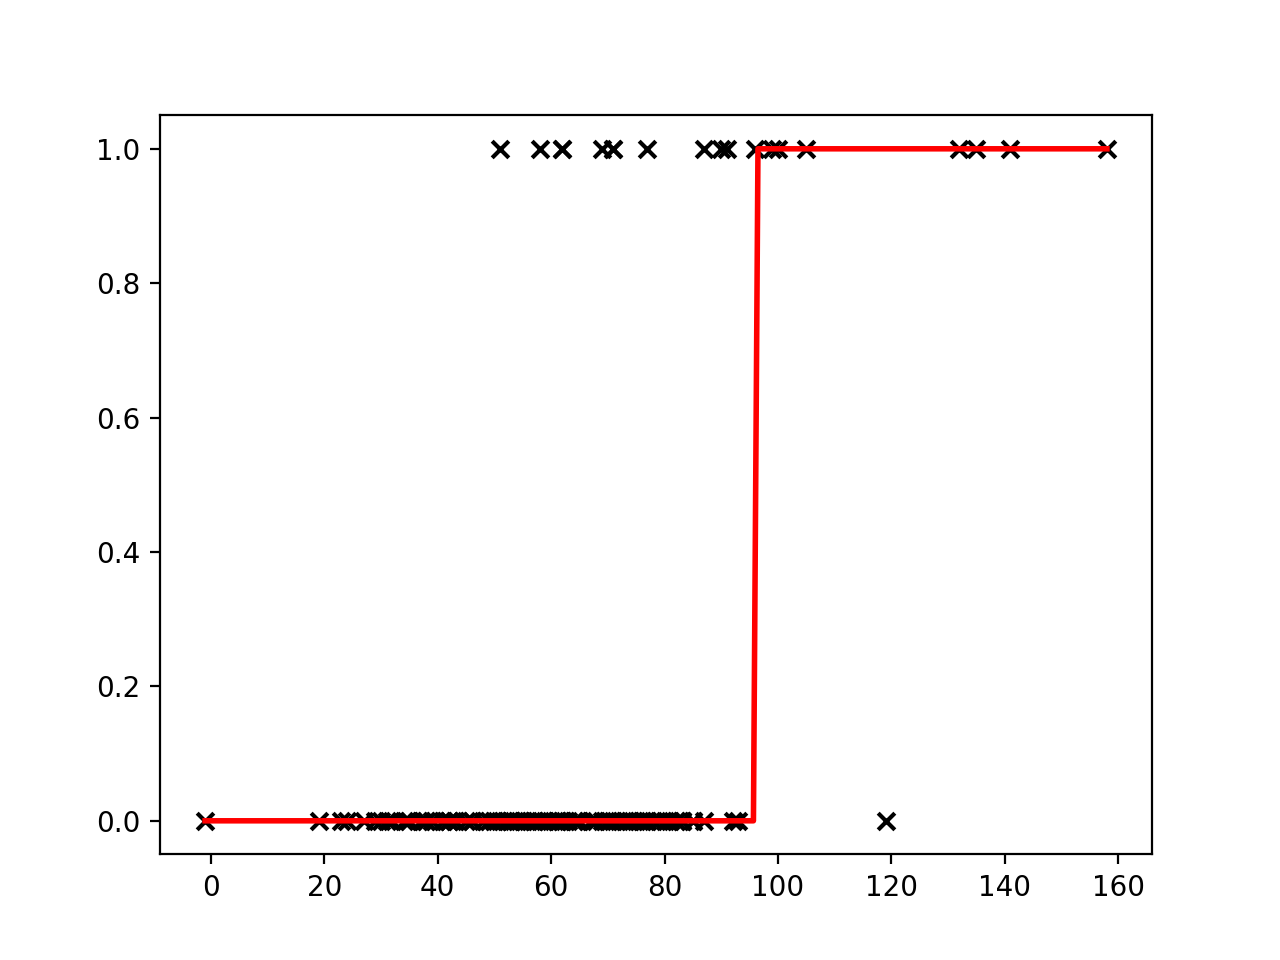
Image 1 of 1: ‘Ren Hayakawa Archery Olympics’
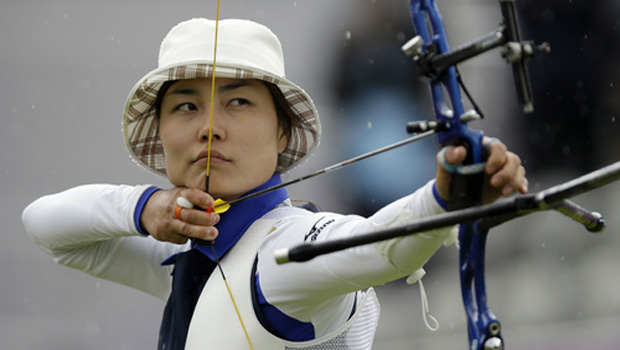
Image 1 of 1: ‘Validation set’

Image 1 of 1: ‘5-fold validation’

Image 1 of 1: ‘Confusion matrix’
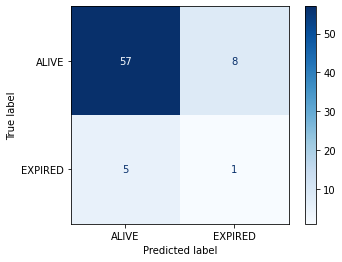
Image 1 of 1: ‘AUROC’
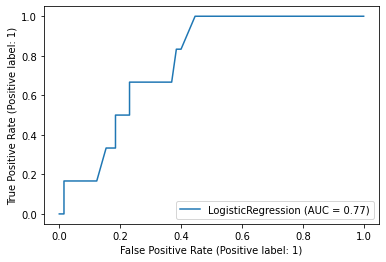
Image 1 of 1: ‘Bootstrapped accuracy’
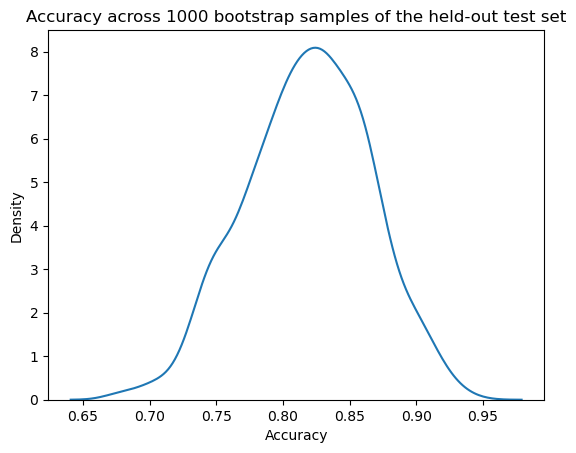
Image 1 of 1: ‘Bootstrapped accuracy with confidence’
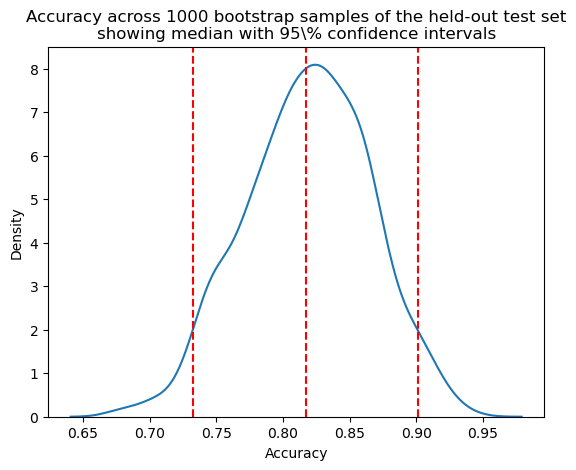
Image 1 of 1: ‘Dataset leakage’