Webscraping with Pandas
Overview
Teaching: 25 min
Exercises: 15 minQuestions
How to use the requests package?
What should we look out for after we get our data from the web?
How to use python operations and functions to clean webscraped data?
Objectives
Show an example of webscraping from start to finish.
[Insert text on what to expect and what is requests (a user-friendly web package)]
To work through the examples below, we first need to load requests:
import pandas as pd
import requests
Getting Data from a Webpage
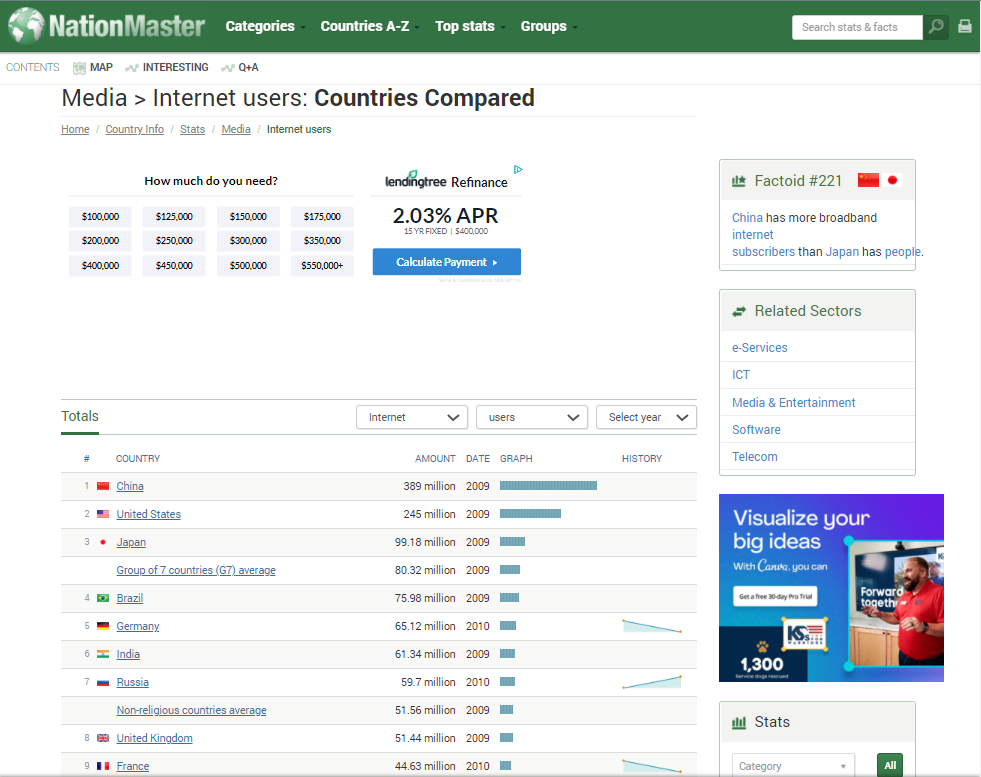
First, download a web page. Here, we are using the website NationMaster.com to get the counts of internet users per country. This example is good because the raw data is potentially very useful for further computation. The page is larded with graphics and ads and whatnot, so simply copy/pasting is not likely to work here.
page = requests.get("https://www.nationmaster.com/country-info/stats/Media/Internet-users")

# N.B.: page content is also cached locally:
# page_content = open("scraping-example-cached.html", mode="rb").read()
page is an object that can be examined. Recall how we can check the type of the object.
type(page)
requests.models.Response
We are also able to check the status of page. A status result of 200 indicates that it is good to continue.
page.status_code
200
We may study the content of page before our initial creation of dataframes.
page.content[:1000]
b`\n<!DOCTYPE HTML>\n<html>\n <head>\n <meta charset="utf-8">\n <meta http-equiv="X-UA-Compatible" content="IE=edge,chrome=1">\n \n \n<script type="text/javascript">;window._taboola=window._taboola||[];_taboola.push({category:\'auto\'});!function(e,f,u,i){if(!document.getElementById(i)){e.async=1;e.src=u;e.id=i;f.parentNode.insertBefore(e,f);}}(document.createElement(\'script\'),document.getElementsByTagName(\'script\')[0],\'//cdn.taboola.com/libtrc/nationmaster/loader.js\',\'tb_loader_script\');if(window.performance&&typeof window.performance.mark==\'function\'){window.performance.mark(\'tbl_ic\');}</script>\n\n <title>Countries Compared by Media > Internet users. International Statistics at NationMaster.com</title>\n <meta name="description" content="" />\n <meta name="author" content="">\n <meta name="viewport" content="width=device-width,initial-scale=1, user-scalable=no">\n \n <meta property="og:type" content="website">\n <meta property="'
From here, have Pandas scan for tables and return a list of auto-constructed dataframes, such that there’s one per table. We have lots of options here, and you may check the documentation here. Caution: tables in the web page don’t necessarily correspond to what you visually recognize as tables. You need to look at the results, locate the dataframe(s) you’re after, then clean it up.
frames = pd.read_html(page.content)
len(frames)
2
frames is a list of three dataframes, and we are able to see what those individual dataframes are with the use of subsetting tools.
frames[0].head()
      #	    COUNTRY                                       AMOUNT	          DATE	   GRAPH	  HISTORY
0	    1	    China	                                        389 million	      2009	   NaN	    NaN
1	    2	    United States	                                245 million	      2009	   NaN	    NaN
2	    3	    Japan	                                        99.18 million	    2009	   NaN	    NaN
3	    NaN	  Group of 7 countries (G7) average (profile)	  80.32 million	    2009	   NaN	    NaN
4	    4	    Brazil	                                       75.98 million	  2009	   NaN	    NaN
frames[1]
    STAT	             COUNTRIES COVERED
0	  2008	             17
1	  Per 100 people     189
Cleaning our Webscraping Returns
# this is the dataframe we want
df = frames[0]
Identify the desired dataframe, so we can start cleaning it as needed. Take a moment to recall the python tools you have learned, and consider which may be helpful in editing the dataframe to be more useable.
Our first dataframe adjustment is setting the row index as Country.
df.set_index("COUNTRY", inplace=True)
df
                                              #	    AMOUNT	       DATE	   GRAPH	HISTORY
COUNTRY
China	                                        1	    389 million	   2009   	NaN	  NaN
United States	                                2	    245 million	   2009	    NaN	  NaN
Japan	                                        3	    99.18 million	 2009	    NaN	  NaN
Group of 7 countries (G7) average (profile)	  NaN	  80.32 million	 2009	    NaN	  NaN
Brazil	                                      4	    75.98 million	 2009	    NaN	  NaN
...	                                          ...	  ...	           ...	    ...	  ...
Niue	                                        214	  1100	         2009	    NaN	  NaN
Saint Helena, Ascension, and Tristan da Cunha	=215	900	           2009	    NaN	  NaN
Saint Helena	                                =215	900	           2009	    NaN	  NaN
Tokelau	                                      217	  800	           2008	    NaN	  NaN
Christmas Island	                            218	  464	           2001	    NaN	  NaN

249 rows × 5 columns
Then, we discard the rows representing aggregates of countries (e.g. ‘Group of 7 countries (G7) average (profile)’).
df = df.loc[~df["#"].isna()].copy()
df
In the above code block, copy() is not nesessary and only used to silence spurious warning. Notice that we went from a dataframe containing 249 rows to a dataframe containing 218 rows.
                                              #	    AMOUNT	       DATE	   GRAPH	HISTORY
COUNTRY
China	                                        1	    389 million	   2009   	NaN	  NaN
United States	                                2	    245 million	   2009	    NaN	  NaN
Japan	                                        3	    99.18 million	 2009	    NaN	  NaN
Brazil	                                      4	    75.98 million	 2009	    NaN	  NaN
Germany	                                      5	    65.12 million	 2010	    NaN	  NaN
...	                                          ...	  ...	           ...	    ...	  ...
Niue	                                        214	  1100	         2009	    NaN	  NaN
Saint Helena, Ascension, and Tristan da Cunha	=215	900	           2009	    NaN	  NaN
Saint Helena	                                =215	900	           2009	    NaN	  NaN
Tokelau	                                      217	  800	           2008	    NaN	  NaN
Christmas Island	                            218	  464	           2001	    NaN	  NaN

218 rows × 5 columns
Use of the info() function allows us to identify the type of data in our dataframe. Why might we want to do this?
df.info()
<class 'pandas.core.frame.DataFrame'>
Index: 218 entries, China to Christmas Island
Data columns (total 5 columns):
 #   Column   Non-Null Count  Dtype
---  ------   --------------  -----
 0   #        218 non-null    object
 1   AMOUNT   218 non-null    object
 2   DATE     218 non-null    int64
 3   GRAPH    0 non-null      float64
 4   HISTORY  0 non-null      float64
dtypes: float64(2), int64(1), object(2)
memory usage: 10.2+ KB
The AMOUNT column is text (“object”) because some column values contain the word “million”. ALso note that Pandas made the entire column text, even those values that don’t contain “million”. Let’s convert the values of AMOUNT to numeric.
Column Value Conversion
Identify and select just those values needing conversion, and we’ll incrementally build up a transformation. In this case, we want the strings under AMOUNT to be numeric.
subset = df.loc[df.AMOUNT.str.contains("million"), "AMOUNT"]
subset
COUNTRY
China                      389 million
United States              245 million
Japan                    99.18 million
Brazil                   75.98 million
Germany                  65.12 million
                             ...
Moldova                   1.29 million
Paraguay                   1.1 million
Bolivia                    1.1 million
Kuwait                     1.1 million
Republic of Macedonia     1.06 million
Name: AMOUNT, Length: 97, dtype: object
By filtering using the .contains() function, we can see that 97 of the 218 rows need converting. We do this by first extracting the numeric portion of each individual value in the column. How do you think we might do this?
subset.str.split(" ")
This code block splits up the values of AMOUNT into a list that is comma-separated at the spaces.
COUNTRY
China                      [389, million]
United States              [245, million]
Japan                    [99.18, million]
Brazil                   [75.98, million]
Germany                  [65.12, million]
                               ...
Moldova                   [1.29, million]
Paraguay                   [1.1, million]
Bolivia                    [1.1, million]
Kuwait                     [1.1, million]
Republic of Macedonia     [1.06, million]
Name: AMOUNT, Length: 97, dtype: object
This next line of code builds off of the split, and leaves out “million”.
subset.str.split(" ").str.get(0)
COUNTRY
China                      389
United States              245
Japan                    99.18
Brazil                   75.98
Germany                  65.12
                         ...
Moldova                   1.29
Paraguay                   1.1
Bolivia                    1.1
Kuwait                     1.1
Republic of Macedonia     1.06
Name: AMOUNT, Length: 97, dtype: object
Now, we are almost done with converting this column to our needs. To finish the conversion, we use a familiar operation and function.
Review - Python Operations and Functions
We want to convert the values of
subset.str.split(" ").str.get(0)to floats, and properly adjust them to the millions. How might we do that?Answer
Recall that ‘.astype()’ allows us to convert values. After the values have been converted to numeric, we can multiply as needed.
revised_subset = subset.str.split(" ").str.get(0).astype(float)*1e6
revised_subset
COUNTRY China 389000000.0 United States 245000000.0 Japan 99180000.0 Brazil 75980000.0 Germany 65120000.0 ... Moldova 1290000.0 Paraguay 1100000.0 Bolivia 1100000.0 Kuwait 1100000.0 Republic of Macedonia 1060000.0 Name: AMOUNT, Length: 97, dtype: float64
Since we have adjusted the values properly, we want to update the dataframe, df, with the new values.
Note that the below line does not update the dataframe.
subset = revised_subset
To update the dataframe, we use .loc[] to pull rows containing the “millions” string, and replace those with the new values we want to use for the dataframe. Are we done?
df.loc[df.AMOUNT.str.contains("million"), "AMOUNT"] = revised_subset
df
                                                #	    AMOUNT	     DATE	   GRAPH	HISTORY
COUNTRY
China	                                          1	    3.89e+08	   2009	   NaN	   NaN
United States	                                  2	    2.45e+08	   2009	   NaN	   NaN
Japan	                                          3	    9.918e+07	   2009	   NaN	   NaN
Brazil                                        	4	    7.598e+07	   2009	   NaN	   NaN
Germany	                                        5	    6.512e+07	   2010	   NaN	   NaN
...	                                            ...	  ...	         ...	   ...	   ...
Niue	                                          214	  1100	       2009	   NaN	   NaN
Saint Helena, Ascension, and Tristan da Cunha	  =215  900	         2009	   NaN	   NaN
Saint Helena	                                  =215	900	         2009	   NaN	   NaN
Tokelau	                                        217	  800	         2008	   NaN	   NaN
Christmas Island	                              218	  464	         2001	   NaN	   NaN
df.info()
<class 'pandas.core.frame.DataFrame'>
Index: 218 entries, China to Christmas Island
Data columns (total 5 columns):
 #   Column   Non-Null Count  Dtype
---  ------   --------------  -----
 0   #        218 non-null    object
 1   AMOUNT   218 non-null    object
 2   DATE     218 non-null    int64
 3   GRAPH    0 non-null      float64
 4   HISTORY  0 non-null      float64
dtypes: float64(2), int64(1), object(2)
memory usage: 20.2+ KB
Almost. The values in the AMOUNT column we did not replace still have type text due to the way Pandas originally constructed the column. It is simplest to just convert the entire column to float.
df.AMOUNT = df.AMOUNT.astype(float)
df
                                                #	    AMOUNT	     DATE	   GRAPH	HISTORY
COUNTRY
China	                                          1	    3.89e+08	   2009	   NaN	   NaN
United States	                                  2	    2.45e+08	   2009	   NaN	   NaN
Japan	                                          3	    9.918e+07	   2009	   NaN	   NaN
Brazil                                        	4	    7.598e+07	   2009	   NaN	   NaN
Germany	                                        5	    6.512e+07	   2010	   NaN	   NaN
...	                                            ...	  ...	         ...	   ...	   ...
Niue	                                          214	  1100.0       2009	   NaN	   NaN
Saint Helena, Ascension, and Tristan da Cunha	  =215  900.0        2009	   NaN	   NaN
Saint Helena	                                  =215	900.0        2009	   NaN	   NaN
Tokelau	                                        217	  800.0	       2008	   NaN	   NaN
Christmas Island	                              218	  464.0	       2001	   NaN	   NaN
df.info()
<class 'pandas.core.frame.DataFrame'>
Index: 218 entries, China to Christmas Island
Data columns (total 5 columns):
 #   Column   Non-Null Count  Dtype
---  ------   --------------  -----
 0   #        218 non-null    object
 1   AMOUNT   218 non-null    float64
 2   DATE     218 non-null    int64
 3   GRAPH    0 non-null      float64
 4   HISTORY  0 non-null      float64
dtypes: float64(3), int64(1), object(1)
memory usage: 20.2+ KB
Here's the payoff:
df.AMOUNT.describe()
Now we may proceed with exploration and further manipulation on this data that we have scraped from the web. Here is the payoff:
count    2.180000e+02
mean     8.523142e+06
std      3.335812e+07
min      4.640000e+02
25%      8.730000e+04
50%      7.082000e+05
75%      4.427500e+06
max      3.890000e+08
Name: AMOUNT, dtype: float64
You may read more on the requests documentation here.
Using BeautifulSoup for More Control (Optional continuation)
You can use BeautifulSoup, an HTML parser, for greater control in selecting which table to pass to Pandas.
from bs4 import BeautifulSoup
soup = BeautifulSoup(page.content)
This returns an object.
type(soup)
bs4.BeautifulSoup
From here, HTML elements can be found through various ways.
soup.title
<title>Countries Compared by Media > Internet users. International Statistics at NationMaster.com</title>
tables = soup.find_all("table")
len(tables)
2
Each HTML element is actually an object that must be converted to a string before passing to Pandas.
type(tables[0])
bs4.element.Tag
Note that Pandas will still return a list even if there’s only one dataframe.
frames = pd.read_html(str(tables[0]))
Now you may proceed as before.
Key Points
Exploring dataframes for usability.
Using basic python tools to get us far.