Formatting Spreadsheets as Data Tables
Overview
Teaching: 15 min
Exercises: 15 minQuestions
What is a relational database?
What are some common challenges with formatting data in spreadsheets and how can we avoid them?
Objectives
Recognise and resolve common spreadsheet formatting problems.
Describe the importance of metadata.
Identify metadata that should be included with a dataset.
A relational database
is a way to store and manipulate information. Databases are arranged as tables. Each table has columns (also known as fields) that describe the data, and rows (also known as records) which contain the data.
You can think of database tables as individual spreadsheets. But spreadsheets with very well formated, ‘clean’ data.
When we are using a spreadsheet, we put formulas into cells to calculate new values based on old ones. When we are using a database, we send commands (usually called queries) to a database manager: a program that manipulates the database for us. The database manager does whatever lookups and calculations the query specifies, returning the results in a tabular form that we can then use as a starting point for further queries.
Queries are written in a language called SQL, which stands for “Structured Query Language”. SQL provides hundreds of different ways to analyze and recombine data. We will only look at a handful of queries, but that handful accounts for most of what scientists do.
Changing Database Managers
Many database managers — Oracle, IBM DB2, PostgreSQL, MySQL, Microsoft Access, and SQLite — understand SQL but each stores data in a different way, so a database created with one cannot be used directly by another. However, every database manager can import and export data in a variety of formats like .csv, SQL, so it is possible to move information from one to another.
For this workshop, we will be using the DB Browser for SQLite.
SQLite
You could do this entire workshop in SQLite. But we are going to use a graphical database tool. In order to use the SQLite commands interactively, you would enter into the SQLite console. So, open up a terminal, and run
$ cd /path/to/survey/data/
$ sqlite3 survey.db
The SQLite command is
sqlite3and you are telling SQLite to open up thesurvey.db. You need to specify the.dbfile, otherwise SQLite will open up a temporary, empty database.To get out of SQLite, type out
.exitor.quit. For some terminals,Ctrl-Dcan also work. If you forget any SQLite.(dot) command, type.help.
Before we get into using SQLite to select the data, let’s take a look at the tables of the database we will use in our examples.
Person: people who took readings.
| id | personal | family |
|---|---|---|
| dyer | William | Dyer |
| pb | Frank | Pabodie |
| lake | Anderson | Lake |
| roe | Valentina | Roerich |
| danforth | Frank | Danforth |
Site: locations where readings were taken.
| name | lat | long |
|---|---|---|
| DR-1 | -49.85 | -128.57 |
| DR-3 | -47.15 | -126.72 |
| MSK-4 | -48.87 | -123.4 |
Visited: when readings were taken at specific sites.
| id | site | dated |
|---|---|---|
| 619 | DR-1 | 1927-02-08 |
| 622 | DR-1 | 1927-02-10 |
| 734 | DR-3 | 1930-01-07 |
| 735 | DR-3 | 1930-01-12 |
| 751 | DR-3 | 1930-02-26 |
| 752 | DR-3 | -null- |
| 837 | MSK-4 | 1932-01-14 |
| 844 | DR-1 | 1932-03-22 |
Survey: the actual readings. The field quant is short for quantitative and indicates what is being measured. Values are rad, sal, and temp referring to ‘radiation’, ‘salinity’ and ‘temperature’, respectively.
| taken | person | quant | reading |
|---|---|---|---|
| 619 | dyer | rad | 9.82 |
| 619 | dyer | sal | 0.13 |
| 622 | dyer | rad | 7.8 |
| 622 | dyer | sal | 0.09 |
| 734 | pb | rad | 8.41 |
| 734 | lake | sal | 0.05 |
| 734 | pb | temp | -21.5 |
| 735 | pb | rad | 7.22 |
| 735 | -null- | sal | 0.06 |
| 735 | -null- | temp | -26.0 |
| 751 | pb | rad | 4.35 |
| 751 | pb | temp | -18.5 |
| 751 | lake | sal | 0.1 |
| 752 | lake | rad | 2.19 |
| 752 | lake | sal | 0.09 |
| 752 | lake | temp | -16.0 |
| 752 | roe | sal | 41.6 |
| 837 | lake | rad | 1.46 |
| 837 | lake | sal | 0.21 |
| 837 | roe | sal | 22.5 |
| 844 | roe | rad | 11.25 |
Notice that three entries — one in the Visited table,
and two in the Survey table — don’t contain any actual
data, but instead have a special -null- entry:
we’ll return to these missing values
later.
Data formatting problems
A super common issue you will have when moving from spreadsheets to databases is that everyone treats spreadsheet programs like a paper notebook.
There’s nothing wrong with this. We all do it. We rely on context, notes in the margin, spatial layout of data and fields to convey information. As humans, we can (usually) interpret these things, but computers don’t view information the same way, and unless we explain to the computer what every single thing means (and that can be hard!), it will not be able to see how our data fit together.
Using the power of computers, we can manage and analyze data in much more effective and faster ways, but to use that power, we have to set up our data for the computer to be able to understand it (and computers are very literal).
Let’s compare two spreadsheets:
A ‘clean’ version of a survey of small farms, and a version that the anthropologist may have brought us in the Library. messy data.
Open these files in Excel or Google Sheets.
Tip
The best layouts/formats (as well as software and interfaces) for data entry and data analysis might be different. It is important to take this into account, and ideally automate the conversion from one to another.
Keeping track of your analyses
When you’re working with spreadsheets, during data clean up or analyses, it’s very easy to end up with a spreadsheet that looks very different from the one you started with. In order to be able to reproduce your analyses or figure out what you did when Reviewer #3 asks for a different analysis, you should
- create a new file or tab with your cleaned or analyzed data. Don’t modify the original dataset, or you will never know where you started!
- keep track of the steps you took in your clean up or analysis. You should track these steps as you would any step in an experiment. You can do this in another text file, or a good option is to create a new tab in your spreadsheet with your notes. This way the notes and data stay together.
Put these principles in to practice today during the exercises.
Structuring data in spreadsheets
The cardinal rules of using spreadsheet programs for data:
- Put all your variables in columns - the thing you’re measuring, like ‘weight’ or ‘temperature’.
- Put each observation in its own row.
- Don’t combine multiple pieces of information in one cell. Sometimes it just seems like one thing, but think if that’s the only way you’ll want to be able to use or sort that data.
- Leave the raw data raw - don’t change it!
- Export the cleaned data to a new file using a universal file format like CSV (comma-separated values).
For instance, this farm data from a study of agricultural practices among farmers in two countries in eastern sub-Saharan Africa (Mozambique and Tanzania). Researchers conducted interviews with farmers in these countries to collect data on household statistics (e.g. number of household members, number of meals eaten per day, availability of water), farming practices (e.g. water usage), and assets (e.g. number of farm plots, number of livestock). They also recorded the dates and locations of each interview.
If they were to keep track of the data like this:
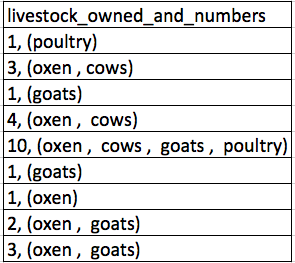
the problem is that number of livestock and type of livestock are in the same field. So, if they wanted to look at the average number of livestock owned, or the average number of each type of livestock, it would be hard to do this using this data setup. If instead we put the count of each type of livestock in its own column, this would make analysis much easier. The rule of thumb, when setting up a datasheet, is that each variable (in this case, each type of livestock) should have its own column, each observation should have its own row, and each cell should contain only a single value. Thus, the example above should look like this:
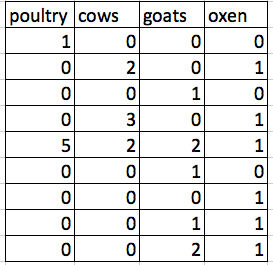
Notice that this now allows us to make statements about the number of each type of animal that a farmer owns, while still allowing us to say things about the total number of livestock. All we need to do is sum the values in each row to find a total. We’ll be learning how to do this computationally and reproducibly later in this workshop.
Workshop Data
The data used in these lessons are taken from interviews of farmers in two countries in eastern sub-Saharan Africa (Mozambique and Tanzania). These interviews were conducted between November 2016 and June 2017 and probed household features (e.g. construction materials used, number of household members), agricultural practices (e.g. water usage), and assets (e.g. number and types of livestock).
This is a real dataset, however, it has been simplified for this workshop. If you’re interested in exploring the full dataset further, you can download it from Figshare and work with it using exactly the same tools we’ll learn about today.
For more information about the dataset and to download it from Figshare, check out the Social Sciences workshop data page.
Exercise
We’re going to take a messy version of the SAFI data and describe how we would clean it up.
- Download the messy data.
- Open up the data in a spreadsheet program.
- Notice that there are two tabs. Two researchers conducted the interviews, one in Mozambique and the other in Tanzania. They both structured their data tables in a different way. Now, you’re the person in charge of this project and you want to be able to start analyzing the data.
- In your breakout room, identify what is wrong with this spreadsheet. Discuss the steps you would need to take to clean up the two tabs, and to put them all together in one spreadsheet.
Important Do not forget our first piece of advice, to create a new file (or tab) for the cleaned data, never modify your original (raw) data.
After you go through this exercise, we’ll discuss as a group what was wrong with this data and how you would fix it.
Solution
- Take about 10 minutes to work on this exercise.
- All the mistakes listed in the next episode are present in the messy dataset. If this exercise is done during a workshop, ask people what they saw as wrong with the data. As they bring up different points, you can refer to the next episode or expand a bit on the point they brought up.
Handy References
Two excellent references on spreadsheet organization are:
- Karl W. Broman & Kara H. Woo, Data Organization in Spreadsheets, Vol. 72, Issue 1, 2018, The American Statistician.
https://www.tandfonline.com/doi/full/10.1080/00031305.2017.1375989
- Hadley Wickham, Tidy Data, Vol. 59, Issue 10, Sep 2014, Journal of Statistical Software. http://www.jstatsoft.org/v59/i10
Metadata
Recording data about your data (“metadata”) is essential. You may be on intimate
terms with your dataset while you are
collecting and analysing it, but the chances that you will still remember
the exact wording of the question you asked about your
informants’ water use (the data recorded in the column water use), for
example, are slim.
As well, there are many reasons other people may want to examine or use your data - to understand your findings, to verify your findings, to review your submitted publication, to replicate your results, to design a similar study, or even to archive your data for access and re-use by others. While digital data by definition are machine-readable, understanding their meaning is a job for human beings. The importance of documenting your data during the collection and analysis phase of your research cannot be overestimated, especially if your research is going to be part of the scholarly record.
However, metadata should not be contained in the data file itself. Unlike a table in a paper or a supplemental file, metadata (in the form of legends) should not be included in a data file since this information is not data, and including it can disrupt how computer programs interpret your data file. Rather, metadata should be stored as a separate file in the same directory as your data file, preferably in plain text format with a name that clearly associates it with your data file. Because metadata files are free text format, they also allow you to encode comments, units, information about how null values are encoded, etc. that are important to document but can disrupt the formatting of your data file.
Some of this information may be familiar to learners who conduct analyses on
survey data or other data sets that come with codebooks. Codebooks will often
describe the way a variable has been constructed, what prompt was associated with
it in an survey or interview, and what the meaning of various values are. For example,
the General Social Survey maintains their entire codebook online.
Looking at an entry for a particular variable, such as
the variable SEX, provides
valuable information about what survey waves the variable covers, and the meaning
of particular values.
Additionally, file or database level metadata describes how files that make up the dataset relate to each other; what format are they are in; and whether they supersede or are superseded by previous files. A folder-level readme.txt file is the classic way of accounting for all the files and folders in a project.
Metadata are most useful when they follow a standard. For example, the Data Documentation Initiative (DDI) provides a standardized way to document metadata at various points in the research cycle. Research librarians may have specific expertise in this area, and can be helpful resources for thinking about ways to purposefully document metatdata as part of your research.
(Text on metadata adapted from the online course Research Data MANTRA by EDINA and Data Library, University of Edinburgh. MANTRA is licensed under a Creative Commons Attribution 4.0 International License.)
Exercise
Download a clean version of this dataset and open the file with your spreadsheet program. This data has many more variables that were not included in the messy spreadsheet and is formatted according to tidy data principles.
Discuss this data with a partner and make a list of some of the types of metadata that should be recorded about this dataset. It may be helpful to start by asking yourself, “What is not immediately obvious to me about this data? What questions would I need to know the answers to in order to analyze and interpret this data?”
Solution
Some types of metadata that should be recorded and made available with the data are:
- the exact wording of questions used in the interviews (if interviews were structured) or general prompts used (if interviews were semi-structured)
- a description of the type of data allowed in each column (e.g. the allowed range for numerical data with a restricted range, a list of allowed options for categorical variables, whether data in a numerical column should be continuous or discrete)
- definitions of any categorical variables (e.g. definitions of “burntbricks” and “sunbricks”)
- definitions of what was counted as a “room”, a “plot”, etc. (e.g. was there a minimum size)
- learners may come up with additional questions to add to this list
Key Points
A relational database lets you compute on multiple tables at once.
Never modify your raw data. Always make a copy before making any changes.
Keep track of all of the steps you take to clean your data.
Organize your data according to tidy data principles.
Record metadata in a separate plain text file.